EOS 30/01/2018 I WRITE AND ANALYZE ONLY EOS/USD PRICE
Analysis of the price of EOS

Intro
In this post I want to talk about EOS.
Since his birth I am interested in him.
I could talk about the project, its future potential and so many things that would not be a post but a book.
I will focus and focus only and only today on the price.
EOS against BTC and ETH
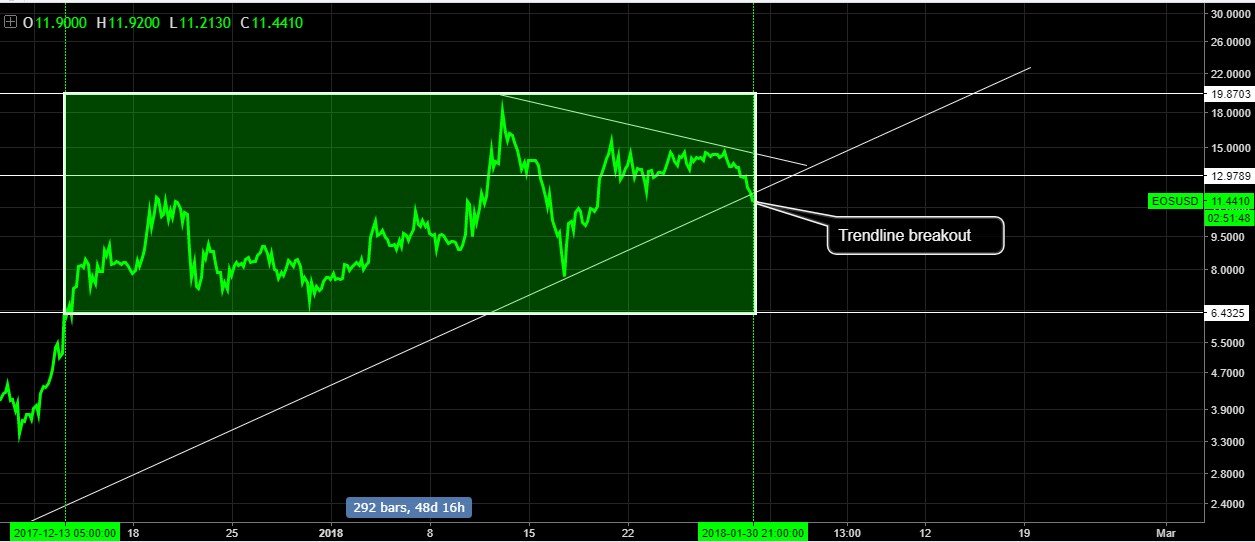
EOS / USD, BTC / USD, ETH / USD Bitfinex TF 240 min

EOS ZONE 1 (Z)

First I see an area of analysis that I delimited by means of two green vertical lines that I will name Z1 which is from 13/12/2017 to the present (30/01/2017)
Why Z1?
If we see well the price of EOS was in a healthy bulrun, strong and without large volatile movements.
What I call: slow, gradual and progressive.
Upon entering Z1, the price began to lose that behavior. He became volatile, although he reached his ATH, he was also followed by a crash.
But that is not important, if we see the area well focusing on all the behavior I see that although it may not seem the price is finding its place. Making complex calculations, is in a channel of important spread, blurred by those pumps and dumps, a channel.
The BTC and its incidence
We can not leave aside the incidence of Bitcoin in this stage of volatility, in which all the cryptomarket has been dragged. Without seeing the first comparative chart, you will see what I am talking about.
If we have a BTC with this type of behavior, like a roller coaster, it will weigh remarkably in all the cryptos.
EOS trendline breakout
While at this moment is having a break in its trendline, I will not give more importance because it is purely and exclusively for what is happening with the BTC.
EOS average price line
For more than we have seen previous strong rises how low there is a line in common, average that is to take into account the price of EOS.
We can talk about EOS and its price affected by FOMO, speculation. Because of how it is affected by the strong fluctuation of the BTC.
But how much of real today is the price of EOS?

My EOS chart from 11/14/2017
In this chart the price of EOS was USD 1.40 and advised to buy everything they can.

And this was the result

Then I made another chart saying that EOS was still cheap and advised to continue buying those who had been left out.
With an EOS in USD 8.- my target was + 100% at least.
EOS Chart of 12/16/2017

And this was the result

To see more clearly and so that they see what I'm aiming with this analysis
Now,
What I want is for you to pay close attention in the range between USD 11.59 / 15.19 where I think that there is the short term key on the price of EOS.
BTC and EOS mirror behavior
Where I see some lateralization, channel, uncertainty and stagnation.
We will see how it is solved
Thank you for reading, for your time and look at the post of what we say in Argentina, a little mojarrita.


was already less than 6: (
The best post @thomasawa @khalil380 Here I hope you can help me let us be just as successful
Dat trasErOS mi diooooó.