The big and small fishes of Augur, Civic, EOS and VeChain: A Statistical Comparison
In this article we are going to compare four projects in terms of the distribution of their respective tokens. The projects are Augur, Civic, EOS and VeChain. We are going to show what is the weight of big and small holders in the total token distribution.
We value your peer-review. Let us know about points we might have missed, all feedback is welcome.
Motivation:
We often hear that a good functioning governance relies on a healthy distribution of the project shares. This makes sense as in decentralization, otherwise decisions may end up being taken by a minority holding large amount of shares. This is not necessarily a bad thing, big investors are likely to seek the best decisions since they are so heavily invested. However, aggregating different opinions and perspectives is known to result in better overall decisions (i.e wisdom of the crowd).
Data:
For all the four projects we accessed the lists of all token holder address data from the Etherscan.io website [1].
Method:
- For each token distribution, we sort the token holding addresses from poorest to the richest.
- Then, starting from the poorest address, we calculate the cumulative sum of tokens as we continue down to the richest address.
- We plot this cumulative sum (on the vertical axis) against the current address' balances (on the horizontal axis).
- To make the curves comparable we divide the cumulative sum and the address balances to the total token supply of each project. In this way all values become ratios of total token supply.
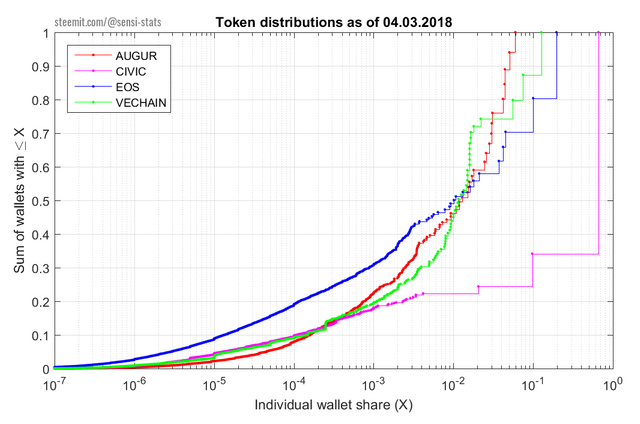
In this way, each point (X,Y) on the curves shows the ratio of project shares Y held by addresses having X or less.
For example: we see that all curves (except Civic) intersect roughly at (X= 0.01, Y= 0.5) meaning that 50% of all the tokens are held in wallets each with less than 1% of the total supply.
Interpretation:
- Civic is the most centralized distribution among all four. With 66% held by the project [2] and a single address holding 1/3 of the remaining 33% sold in the token sale.
- For Augur the richest address holds the least amount (5%) of all tokens. Although, for comparison, we should keep in mind that the EOS distribution is still going on. The richest EOS address that holds 20% of all tokens will be gradually emptied by the end of the distribution (end of June).
- In terms of broadness of the distributions, EOS is more widely distributed among wallets with small amounts. We see this for wallets holding from 0.00001% to 1%. These wallets' contribution to the total sum is consistently larger when compared to the other distributions. This may be attributed to the novel distribution method that auctions a fixed amount of tokens on a daily basis [3].
Limitations:
Here we summarize some of the limitations that might affect the interpretation of the data analysis
- Users with multiple wallets: If users are holding their tokens in several wallets with different addresses this will show up as an artificial spread in our distribution analysis. However, since we are comparing several projects relatively to each other, unless users of some projects tend to create more multiple wallets than other projects, we do not expect this effect to change our relative interpretations
- Large exchange addresses: Users might keep their tokens on exchanges and hence they would appear under a single large address. Thus if a token has a higher trading volume it will tend to appear artificially more centralized due to the large exchange presence.
We value your peer-review. Let us know about points we might have missed, all feedback is welcome.
@dan always posts about the EOS. He is the one resteemed this post.My curiosity increases as to what actually EOS is..This is the time for learning!
Dan makes EOS haha :)
Could you compute the Gini Coefficient?
G = A / (A + B)
Thank you for the suggestion. It would be interesting to compute the Gini Coefficient. There is one concern though: in the case of wealth distribution of populations the people with very little to no money are the poor and they are just as real (certain) as the rich . However, in most token distributions there are many wallets with near zero balance that are most likely transaction leftovers.
For example, for EOS there are many many accounts with near zero balances (see on the linked figure). This large number is probably because of the many transactions causing rounding leftovers.
https://postimg.org/image/nga4g4yf9/
These would bias the Gini calculation significantly, thus we would probably need to introduce some kind of cut-off. But that would be tricky because the results may change depending on what cut-off value we choose. Let us know if you have ideas to tackle this.
Thanks for the analysis! Have you considered sharing the code used for the analysis?
The code is written in Matlab/Octave. It relies on data tables named according to each project, containing two columns (address and balance). We scrape this data from the Etherscan.io website using a generic crawler and parser.
@hr1 thanks for your voting.
Coins mentioned in post:
Nice post beautiful presented and explained. detail oriented with nice information. thank you for sharing
Wow, that's quite interesting.
Civic Token has no true use if their original objective is for ID and it should mean distribution to as many individual as possible, yet their founder gets a lump sum of the Tokens. People get swayed into buying easily so do be careful and Do your own research, always. It will fail also those Tokens that linked to credit card such as Tenx or Monaco. It's beyond logic, the system that supposed to diminish credit cards cooperating with credit cards, so yes credit card cartel now start to shut down their ties.