EOS Teknik Analizi Güncellemesi / EOS Technical Analysis Update [25.04.2018]
Selam arkadaşlar;
Burada yer alan bilgi, yorum ve değerlendirmeler Yatırım Danışmanlığı Kapsamında DEĞİLDİR. Yapmış olduğum analiz ve değerlendirmeler teknik verilere dayalı eğitim çalışmasıdır.
17.04.2018 tarihli günlük grafiktir / The daily chart dated 17.04.2018
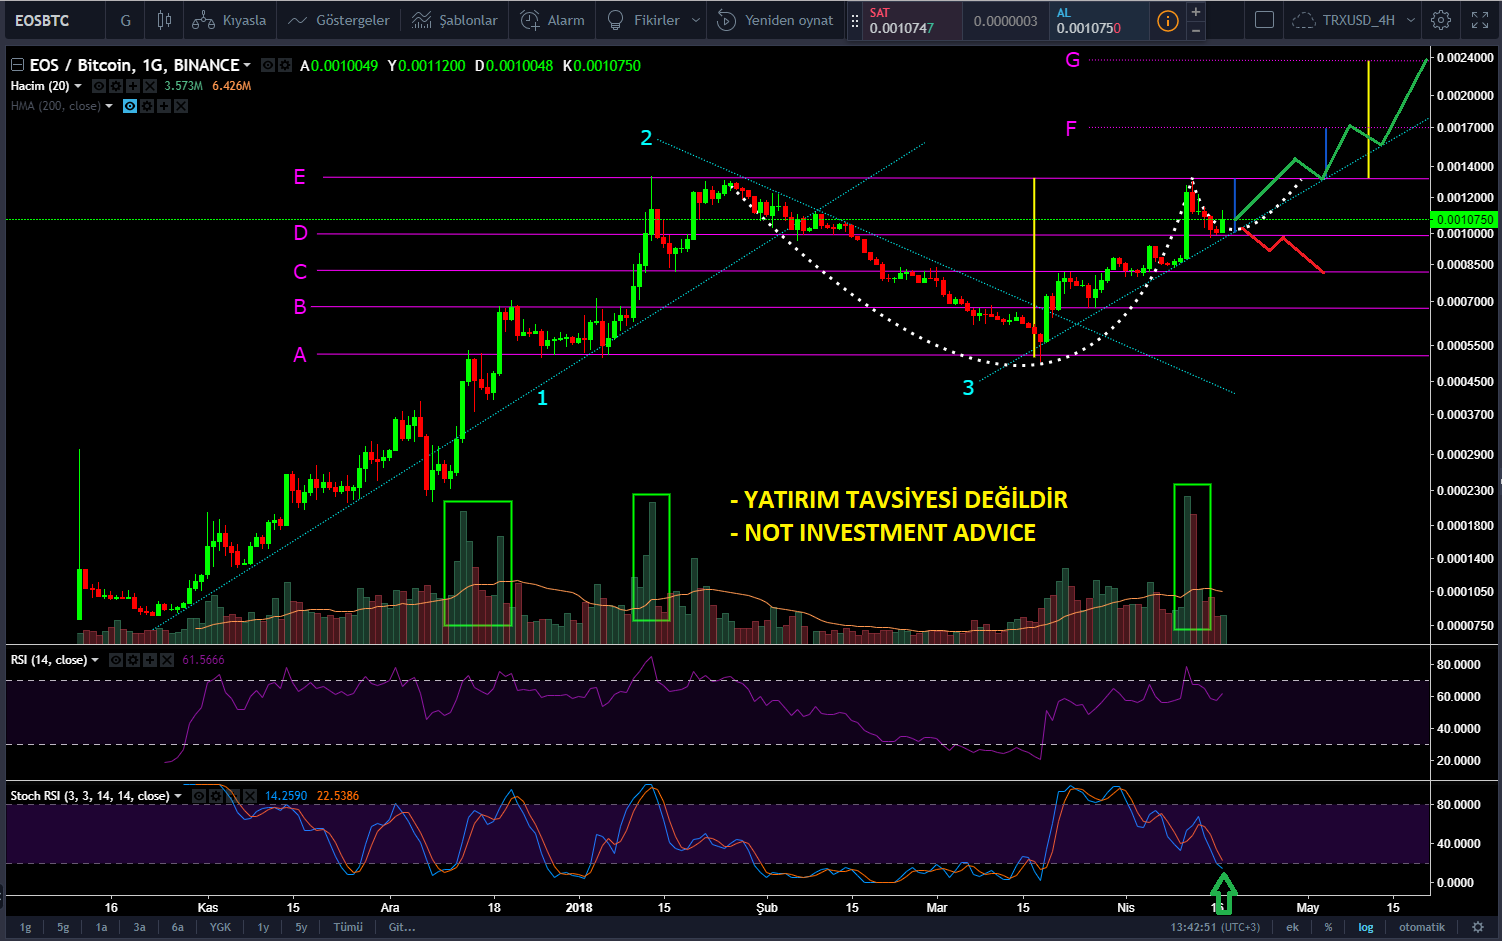
Logaritmik ölçekli günlük grafiktir / Daily chart with logarithmic scale
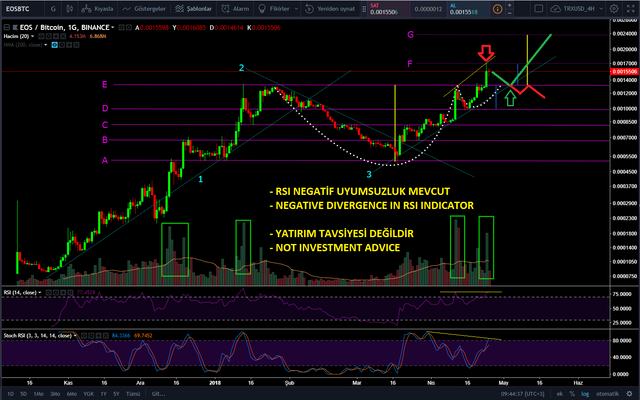
- EOS grafikte belirtmiş olduğum E direncini kırarak birinci hedefi olan F trendine ulaştı. Bu seviyeden satış baskısı oluştuğunu görmekteyiz.
- RSI ve STOCH RSI indikatörleri ve fiyat arasında oluşan negatif uyumsuzluk neticesinde bir süre düzeltme olmasının muhtemel olduğunu düşünmekteyim. Bu hareket gerçekleşir ise E trendinin yeniden test edilmesi düşünülebilir. Bu sayede eski direnç olan E trendi yeni destek olacaktır.
- Fiyattaki hacim artışı ise orta ve uzun vade için oldukça olumlu görünüyor.
- Grafikte belirtmiş olduğum yeşil ve kırmızı çizgiler fiyat hareketinin izleyeceği muhtemel yolları göstermektedir (Tamamen şahsi görüşümdür. Gerçekleşmesi kesin değildir.).
Teknik analiz ile ilgili sorularınızı ve eleştirilerinizi yorum olarak yazmanız beni mutlu edecektir. Analiz etmemi istediğiniz kriptoparaları yorumlarda belirtebilirsiniz.

English
Hello Friends;
The informations, comments and evaluations contained herein are NOT IN Investment Advisory. The analyzes and evaluations I have made are based on technical data.
- EOS breaks the resistance of E that I have indicated in the chart, reaching its first target F trend. We see that there is a sales pressure from this level.
- I think it is likely that there will be a correction in the period due to the negative mismatch between RSI and STOCH RSI indicators and price. If this action occurs, retesting E trend may be considered. On this count, the old resistance E trend will be the new support.
- The increase in volume at the price is quite positive for the medium and long term.
- The green and red lines that I have indicated on the graph indicate the possible ways in which the price movement will follow (It is completely personal, it is not certain that it will happen).
I would be happy if you write down your comments about technical analysis. You can specify the cyriptocurreny you want me to analyze in comments.