EOS/XBT (BTC) head and shoulders forming 25/09/18 Update 3
The moves on this chart are quite incredible and for the short term trader some nice profits could have been made.
I am following this nice Head and Shoulder (HS) pattern which is developing and it seems like we should be close to the completion of the pattern. If all goes accordingly and the neckline is breached followed either by a retest of the neckline or a flat out drop in price, we could be looking at quite a drop.
This is the chart from update 2 without any update to any of TA.
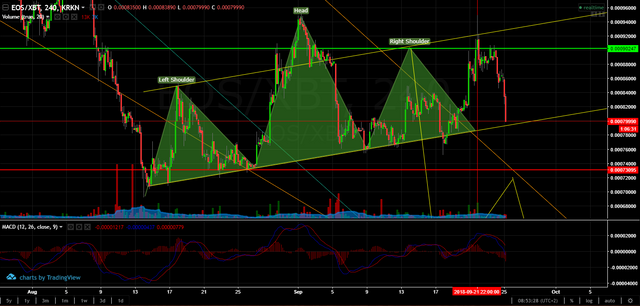
What can we see?
- A short break of the neckline which the bulls quickly overcame on the 18th September.
- The horizontal red line is where I was expecting a break for the HS pattern since this would for the most symmetrical pattern, though these patterns are rarely ever perfectly symmetrical. Instead this point acted as the touch and breach of the high of the right shoulder. A short entry here would have been both aggressive and correct.
- After the horizontal red line some candle sticks showing uncertainty in direction followed by a sharp drop.
What could happen?
- A break of the neckline followed by a drop in price.
- A bounce on the neckline followed by a hike in prices which would mean a failed HS pattern.
The following is an updated chart with the new price action.
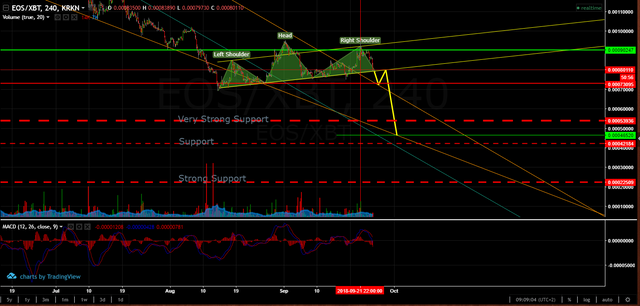
I have taken a step back and zoomed out to better show what possibilities lie ahead if indeed the neckline is breached and the price continues to drop.
So what would the target to buy back into EOS be. Generally the expected dip if there are enough bears in the market would be 1.5 times the height from the top of the head to the left shoulder. This is the semi green horizontal line market at 0.00046520 satoshi. However before that we would need to break through:
- The solid red horizontal line at 0.00073095 satoshi where I suspect we may see some rebounding action.
- The horizontal line marked as Very Strong Support (VSS). This line has proven to be support in July, August and December 2017 and January and March 2018.
If the 2nd comes true and the VSS is breached we could see the full potential of the HS target be reached.
Do I think this will happen and VSS will be breached followed by the target and the Support and Strong Support. Realistically no. However it is possible. This does not necessarily mean that EOS is losing value. It could mean that bitcoin has just shot up and a possible decoupling of the movement of cryptos.... but that's a different discussion and would require its own post entirely.
So what is my current position. I have been a bit aggressive and have flipped a small portion of my EOS into BTC . EOS holder for life :)
The next step. I will be looking at the VSS line to see what price action (PA) goes on around that area since my target is the green line just below. That is where I will consider flipping back into EOS.
This is what is happening now and sentiment can change in a heart beat. News can come out and people may react rationally or irrationally towards it. It has happened in the past and will happen again sometime, someday.
Remember, this is not financial advice, some people say technical analysis does not work, and there are times that patterns do not complete or complete and do the opposite of what it "should". If you have not come to your own conclusion that you should short or go long then do not do it.
Peace, Love, Crypto.
You have a minor grammatical mistake in the following sentence:
It should be its own instead of it's own.