EOS Block Producer Illustrative Revenue Analysis - How will a Block Producer be rewarded?
Disclaimer: We are aware that the block reward system is in constant change. At the original date of posting, this model encapsulated the latest information available. Once more definitive information becomes available, we will be reworking the model to reflect those changes.
One of the first steps any business has to take before opening up shop is to run an analysis on their projected revenue and return. We at EOS Canada felt that the community would benefit from a public model that can be tailored to each person’s assumptions to help in their decision making. After all, if a Block Producer (BP) or Standby Producer (SP) can’t fund their operation, they would have to drop out of their role.
We first published this on the EOSGo forums on March 29, 2018 , and it quickly made its way through the community. We wanted to make a post to describe how it should be used, so that anyone in the community can play around with it and answer any questions they may have regarding the financial scenarios surrounding a BP.
This may be a good time to hop on over to our site and open up the model to follow along. This is a read-only version, so if you’d like to plug in your own numbers to see how things will change, feel free to download the file and make all the changes you’d like. It’s an interactive sheet that will update automatically with your inputs.
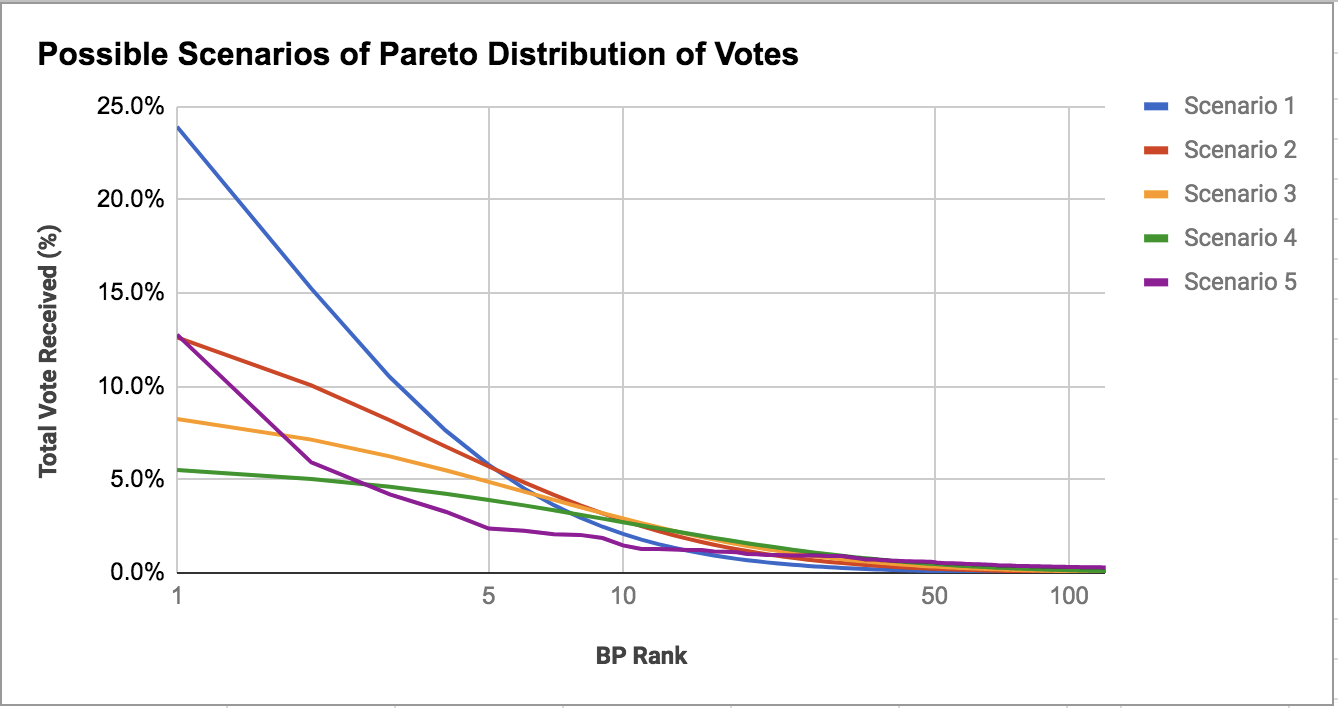
Something that is worth spending a moment on is the Pareto Distribution that we used in our model. This is more famously known as the 80-20 Rule. 80% of a given distribution will tend towards the top 20%. In our case, the assumption is that 80% of the votes will tend towards the top 21 BPs. There are 5 distinct scenarios that the allocation within that group will tend to follow. If you tab over to the sheet titled “Pareto Distribution,” you’ll find those scenarios graphed out. If you have any further questions on this, we invite you to read through the Wikipedia Page here.
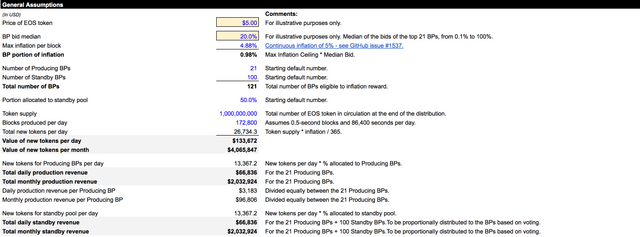
Let’s begin on the second tab, Assumptions and Revenue Analysis. It’s worth going through some of this line by line, as it’s not immediately clear without some background information.
Line 9 - Price of EOS Token - The price of each EOS token on the open market will be a major driving factor in the revenue of a BP, as once they receive their share for operating as a BP or a SP, they will most likely need to convert to fiat currency to pay their operating expenses. As this price will fluctuate, so will the revenue model, so plug in different scenarios that you think are possible to study the different outcomes.
Line 11 - BP median bid - We need to first understand that 5% is the maximum inflation as coded into the system. So the median bid is a function of how much of that 5% a BP is proposing. To put this in numbers, 20% of 5% is 1%, so a bid of 20% is effectively a bid for 1%. Likewise, a bid of 40% is equal to 2% inflation.
Line 12 - Max inflation per block - It’s worth looking at the link in the comments cell to the right, as Thomas Cox provided the math as to why the 4.88% continuous inflation equals a 5% annual inflation.
Line 19 - Portion allocated to standby pool - 50% of the daily distributed token rewards will be allocated to the top 21 BPs, and the remaining 50% will be distributed amongst the top 121 BPs and SPs proportional to the amount of votes they received.
Lines 21-25 - This shows the amount of tokens that will be created daily and monthly, as well as a dollar amount according to the assumed token price.
Lines 27-31 - This shows how many tokens will be available to distribute amongst the top 21 BPs, as well as a dollar amount according to the assumed token price. It shows the average revenue of the BPs.
Lines 33-35 - This shows the daily and monthly dollar revenues to be split proportional to voting results amongst the top 121 BPs and SPs.
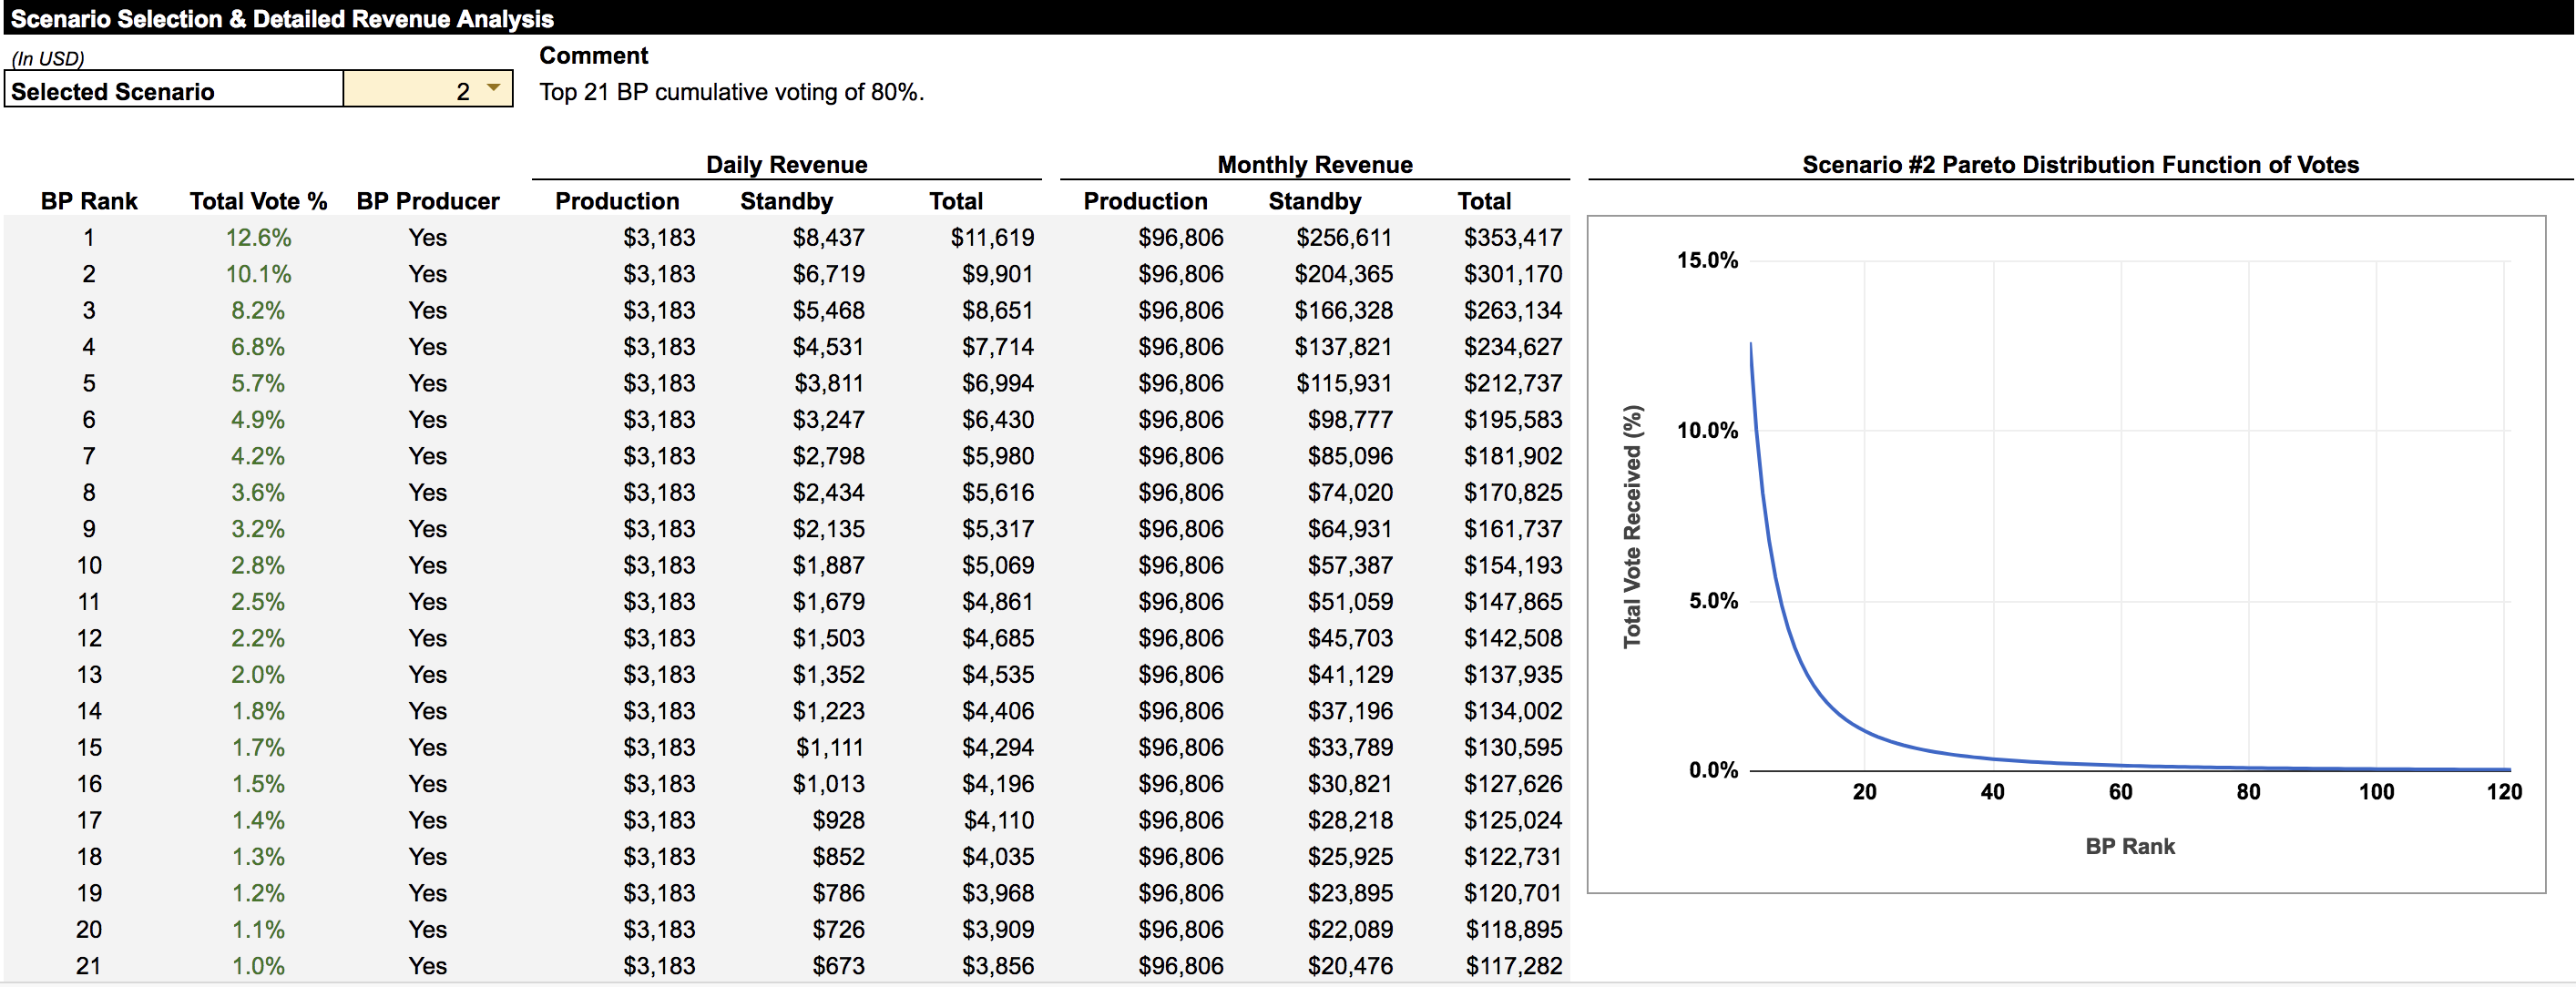
Line 39 - Selected Scenario - There is a drop down menu from which you can choose one of the five different Pareto Distribution models (these can be found in the tab Pareto Distributions).
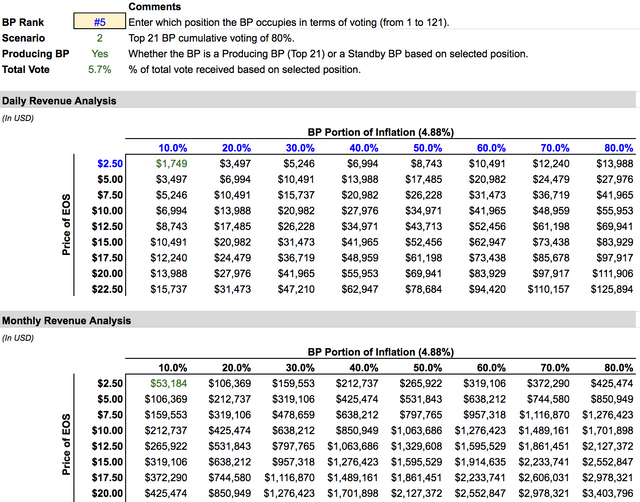
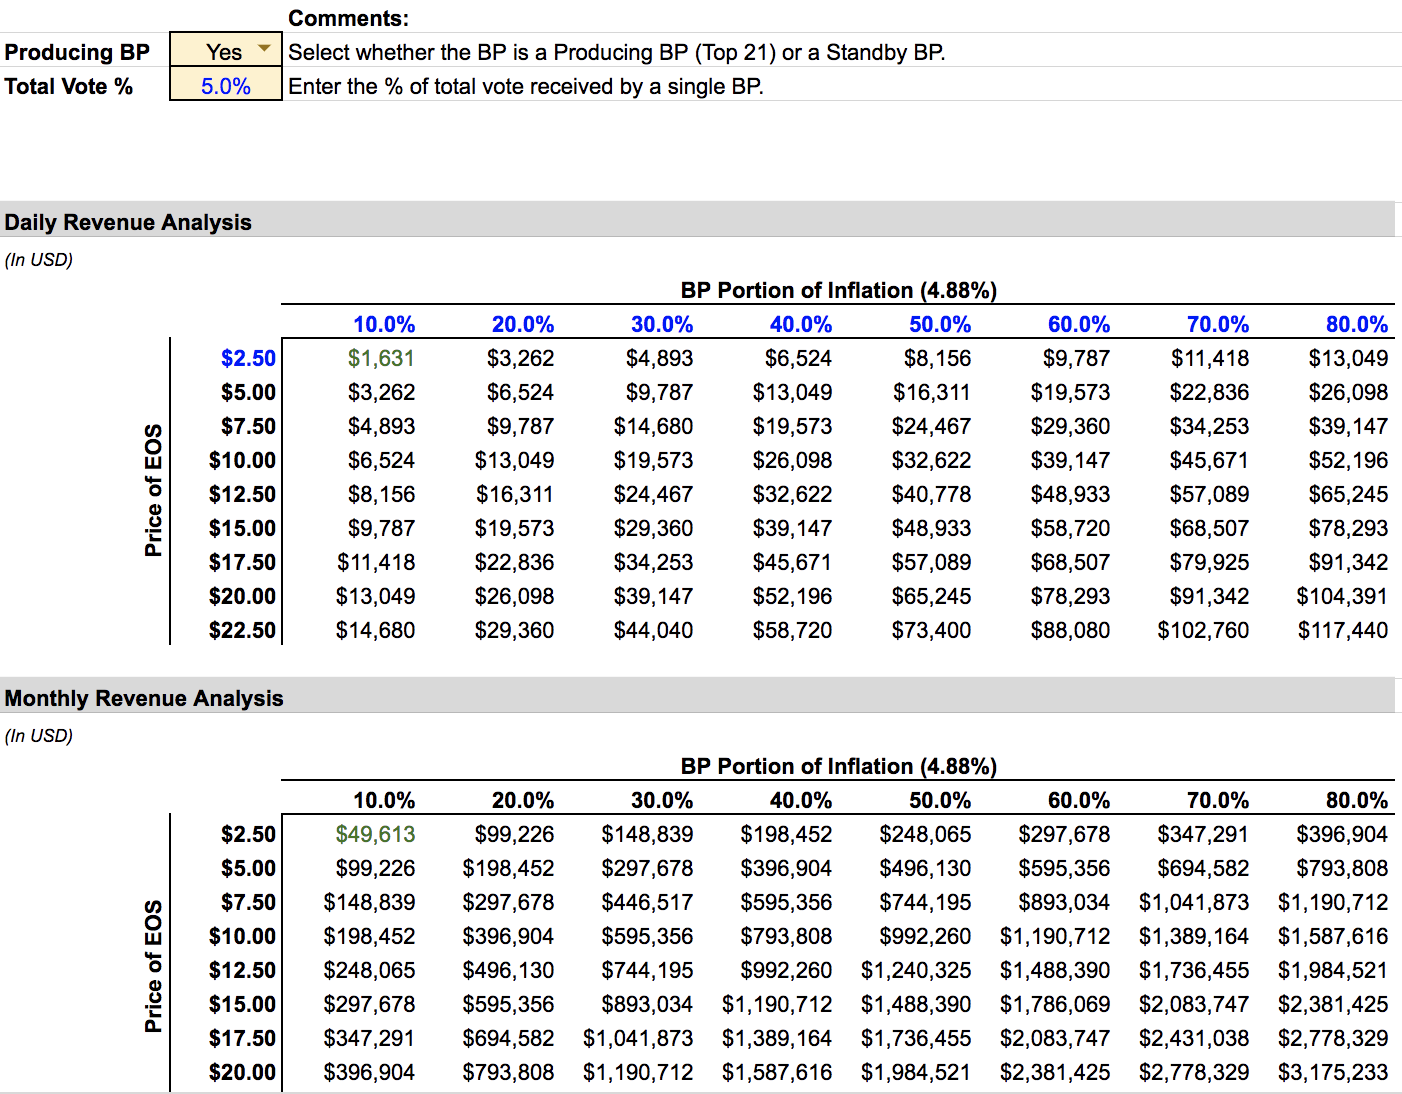
Now we’ll move over to the next tab, Sensitivity Analysis. This sheet is split into two different sections. On the left, it is pulling data from the previous sheet to display information according to the Pareto Distribution selected. On the right side of the sheet, you can plug in your own assumptions.
From these assumptions, the tables below will output revenue amounts based upon the price of a token versus the inflation rate going towards BPs.
Line 9 Left - BP Rank - You can input different rankings that you think you will get to as a BP or SP.
Line 9 Right - Producing BP - You can toggle between whether or not you’ll fall into the 21 BPs (Yes) or the SPs (No).
Line 10 Right - Total Vote % - You can input the percentage of the votes that you think you will get from the community.
Hopefully this helps the community to figure out what the expected revenues could be for the BPs and SPs, and clears up a few misunderstandings. Something to think about is that to ensure we have a healthy pool of BPs and SPs, there needs to be enough of an incentive for even the 121st SP to operate their node. As new information comes out from block.one, we will work to put out an updated model for the community.
If you have any questions or comments, please feel free to comment here, or connect with us in whichever way is most convenient for you.
Contact Info:
Twitter: @EOS_Canada
Telegram channel
SteemIt: @EOS-Canada
YouTube
Website
E-mail: [email protected]
Block Producers have standby revenue too? How does that work?
My guess is that the standby revenue is allocated proportional to the % of vote the BP have received whether or not they produce block. Are my assumption correct?
EOS seems so well thought out. The fact that inflation and the % of inflation that is distributed to standby BP can be changed by BP is so perfect. Currency creation and decentalized networks at its best.
the remaining 50% will be distributed amongst the top 121 BPs and SPs proportional to the amount of votes they received.This is just so considerate and well thought-out. This system is just going to be so viable and expressly beautiful. June 2 is beginning to look like forever . I just can't wait.
Thank you! I had overread that part.
Thomas posted this video 2 days ago it seems:
It introduces some new concepts such as a "BP revenue cap". Is this a new revenue model?
OK, That video is gone now from Thomas' VIMEO collection. Lets just wait and see what the new model will be.