EnergyCoin (ENRG) - Fast Trade (1010%+ Profits Potential)
I've been looking at EnergyCoin ( ENRG ) for a few days, receiving many different signals. I already received many messages asking me to review this coin, to analyze the charts for a possible trade... Well, here it is, this is your exclusive trade for EnergyCoin. Exclusive, because this trade is being analyzed exclusively for you.
Seeing how the altcoins react to Bitcoins -9.60% correction is a good way to measure their strength. Some coins will go on a downward spiral, others will go down and stay low but some others, the ones that are interesting to us, will go down and bounce strong back to the same level it was before the start of the correction. Look for this signal on all of my open trades by visiting my profile, you can reload on coins that do this and open some very strong positions to profit for weeks to come. EnergyCoin ( ENRG ) gave this signal with a strong bounce today.
Now, let's look at the indicators and charts, let's see how we can profit from this trade.
*** Instructions
Before we look at the charts and indicators, for short (1 day) and long (1 week) term, first let's look at the trade details:
Buy-in range: 0.00001650 - 0.00002500
Note: This is the price range which you should use to buy into this coin. If the price is within this range, then you are safe to buy and hold. You buy and hold to finally sell on target. Which is the price levels that you will see below...
EnergyCoin Targets:
(1) 0.00005311
(2) 0.00008011
(3) 0.00012111
(4) 0.00015411
(5) 0.00019011
Note: This is where you sell for profits. You can sell any amount you want at each target. This is completely up to you. I normally sell small portions on each target. You can set up the sell order and go to sleep and come back in a few days or weeks to collect your profits. There is no need to look at the screen 24/7. Trust me, it works on autopilot. Set it and forget it.
Stop-loss: 0.00001320
Note: This is the price level where we stop our trade. If something goes wrong, the trade doesn't go as planned, this is where we stop our loss.
*** Indicators
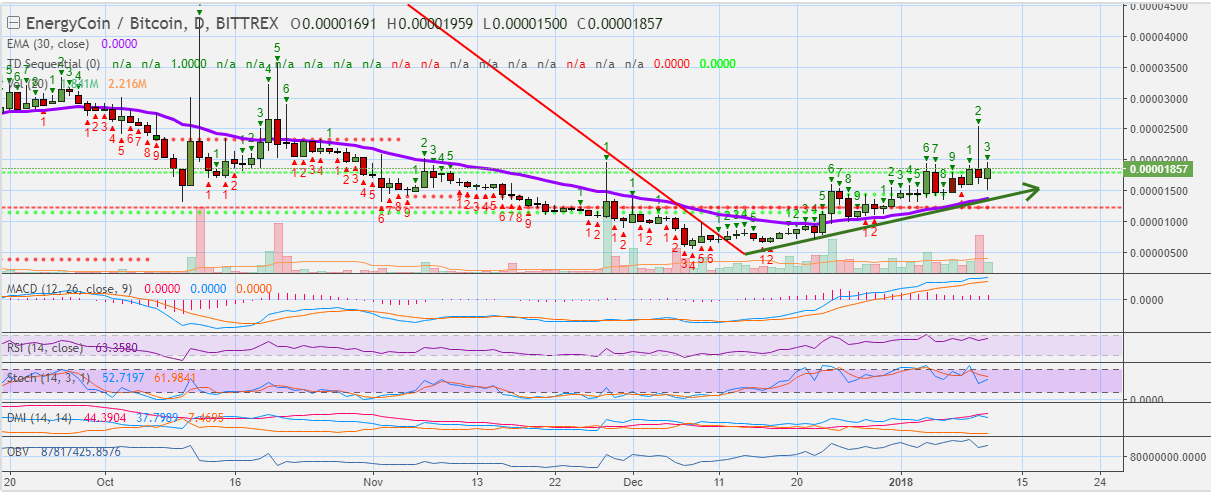
The daily chart is bullish because all of the indicators are on the bullish zone, this coin needs to accumulate, to build momentum and finally take off.
Looking at the shorter term, the 1h, 2h and 4h are all looking really good, they are basically saying "Hey, coin join me, there is still plenty of time to ride this wave, join this trade..."
Now, the weekly chart is the type of chart that I like. I don't like coins that are shooting up, I like coins that can shoot up or are about to shoot up, these are the most profitable trades. Yes, you have to wait, yes. Patience is needed, YES, but if you join at the bottom, or near the bottom, then you can profit from the entire ride up with little risk. And you can profit a lot. So, it is worth the wait.
The weekly chart is turning bullish . The TD
 Sequential went through a negative 9 count and it is now on a positive count, we are at number 4.
All the indicators, MACD , RSI , STOCH & OBV are turning bullish , they want to look up to finally go up, and they show plenty of room for growth. So we want to join this trade, by buying this coin, then sit back and relax to enjoy the ride. The ride to the top.
Low trade volume allows for plenty of room for growth.
Targets may take time to develop.
Trade is going great. i recommended it was merely 1857 sats.
Keep your trades on and do not forget to upvote.
After such a huge climb, it is normal to see a "retrace" in price.
Here is how these retrace work.