NZDUSD Finds Support: Elliott Wave Analysis
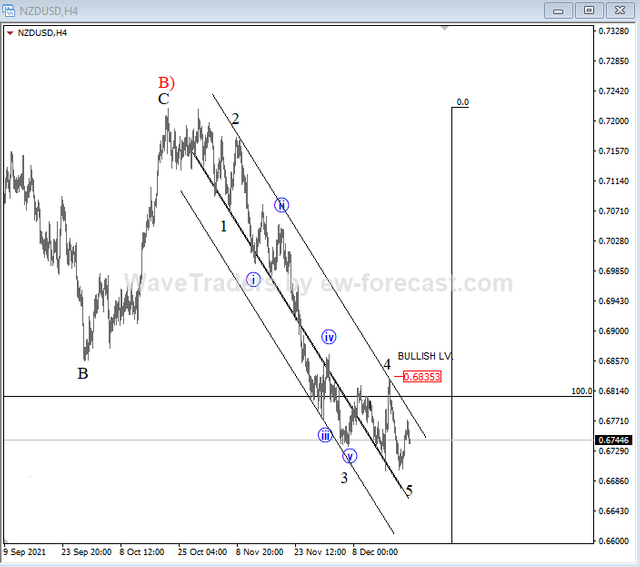
NZDUSD is accelerating lower, so it appears that Kiwi is trading in deeper A)-B)-C) correction on a daily chart, which can be in the final stages now, as we can see it finishing a five-wave cycle and potential wave 5 in the 4-hour chart. However, there's still room down to 0.66 - 0.65 area before it finds the support, but any early strong recovery back above channel resistance line and 0.6835 level would be signal for the bottom.
NZDUSD 4h Elliott Wave analysis

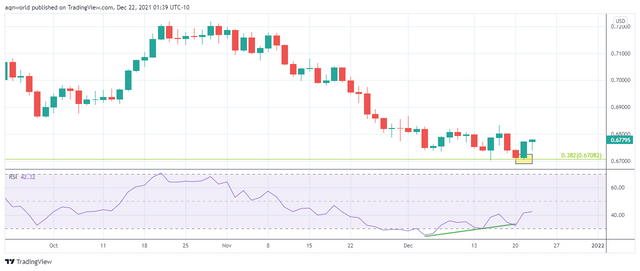
Technically speaking, NZDUSD tests 0.382 Fibonacci retracement of March 2020's low to Feb 2021 high with Bullish Engulfing candlestick pattern and RSI daily unfolds bullish divergence, looks like NZDUSD approaches support and eyes high from this level.
NZDUSD Daily Candlestick Chart
