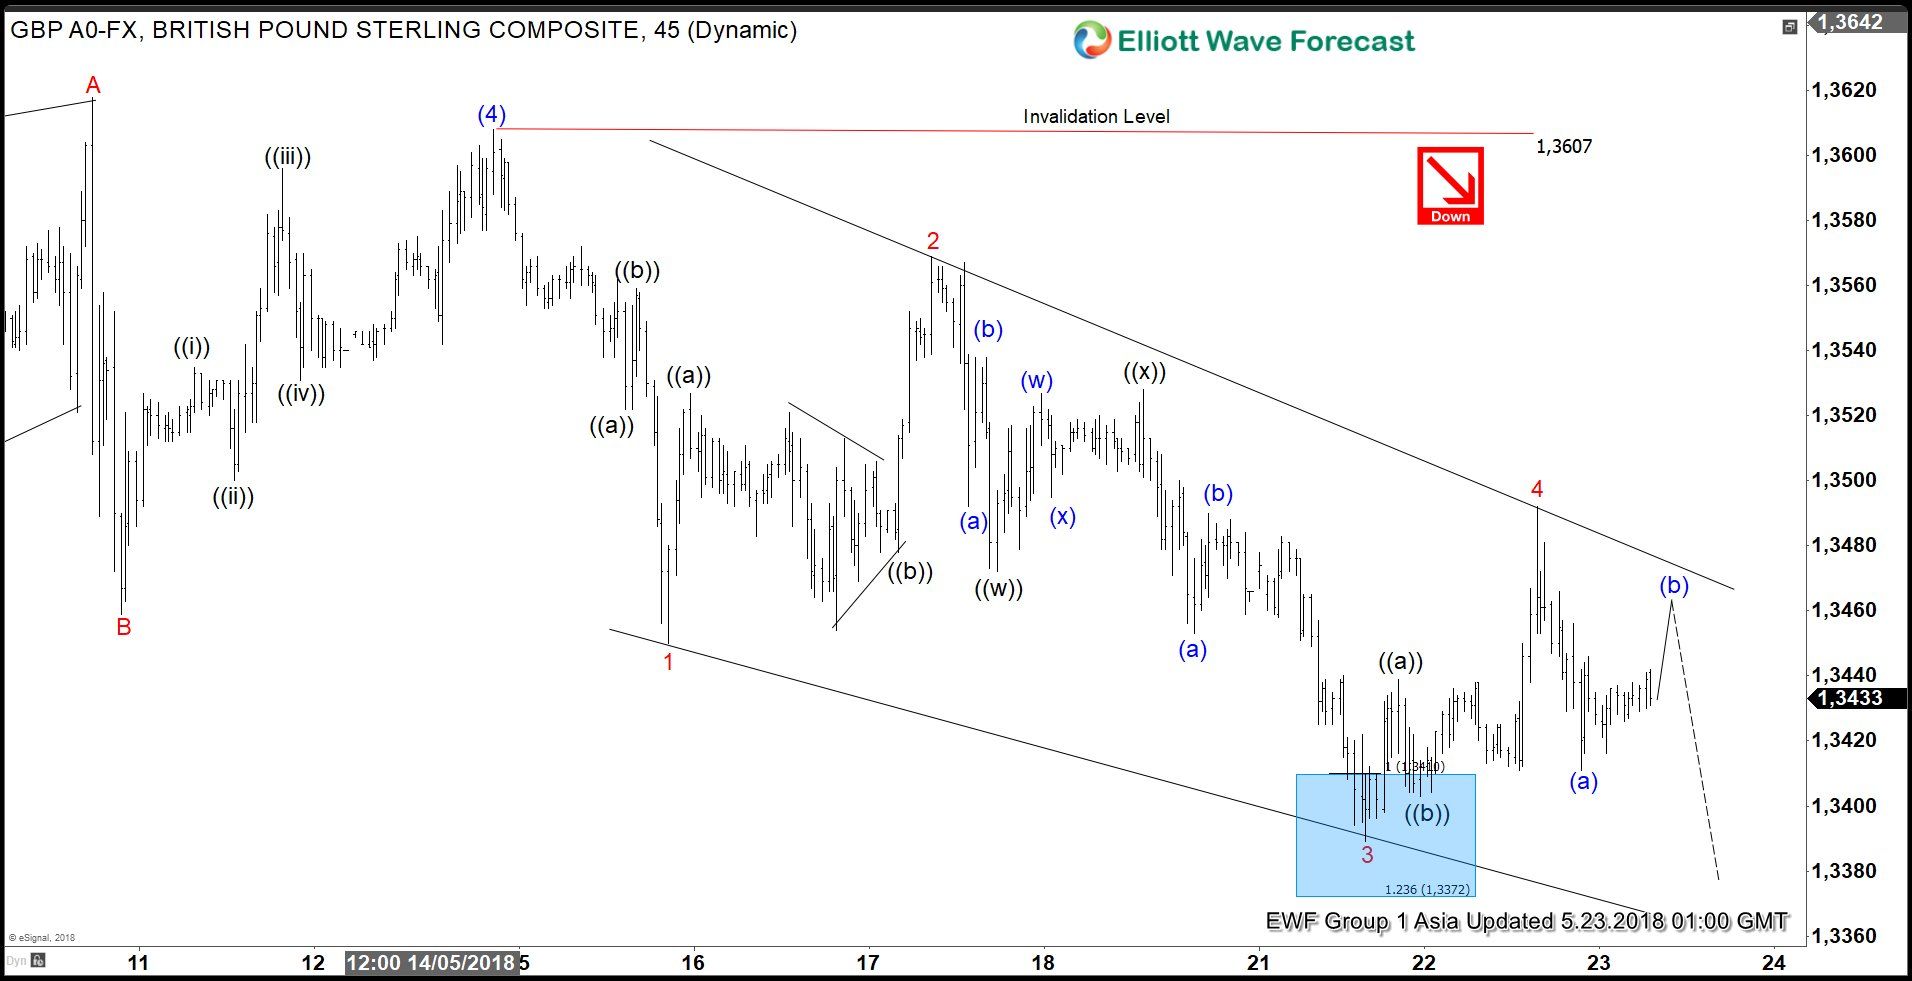
GBPUSD Elliott Wave View: Showing Impulse Structure
GBPUSD Elliott wave view in short-term cycle suggests that the decline from 4/17/2018 high (1.4377) is unfolding as an impulse Elliott wave structure where bounce to 1.3607 high ended Intermediate wave (4). Down from there, intermediate wave (5) remains in progress as Elliott Wave ending diagonal structure. Ending diagonal usually appears in the sub-division of wave (5) of impulse or wave (C) of a Zigzag correction with internal distribution of 3-3-3-3-3 corrective structure. It also commonly shows a wedge shape and has overlap between wave 1 & 4 when wave 4 may or may not enter the territory of wave 1.
In the case of GBPUSD, the decline from 1.3607 high to 1.3450 ended Minor wave 1 of (5) as a zigzag structure. Then the bounce to 1.3569 high ended Minor wave 2 of (5) in 3 swings as a zigzag structure. Down from there, the decline to 1.3389 low ended Minor wave 3 of (5) as Elliott wave double three structure. Above from there, the bounce to 1.3492 high ended Minor wave 4 of (5) which shows the overlap with Minor wave 1. Near-term, below from 1.3492 high, Minor wave 5 of (5) remains in progress which can extend to 1.3333-1.3295. This area is where Minor wave 5 = Minor wave 1 or 100%-123.6% Fibonacci extension area to end the cycle from 4/17/2018 peak. Afterwards, the pair is expected to do a bounce in 3 swings at least. We don’t like buying it into proposed bounces.
GBPUSD Elliott wave 1 Hour Chart

Source : https://elliottwave-forecast.com/forex/gbpusd-elliott-wave-showing-impulse/