Tech Analysis 101 - Fundamentals Part 2 - Trends
Good morning Students, Miss Behavin here again. Today we are going to cover Trends.
What is a trend?
The entire premise of Technical Analysis is that price movements are viewed, and act in trending patterns. A trend is a straight line that touches at least 2 points within the chart. These lines serve to distinguish area's of Support or Resistance
UP TRENDS
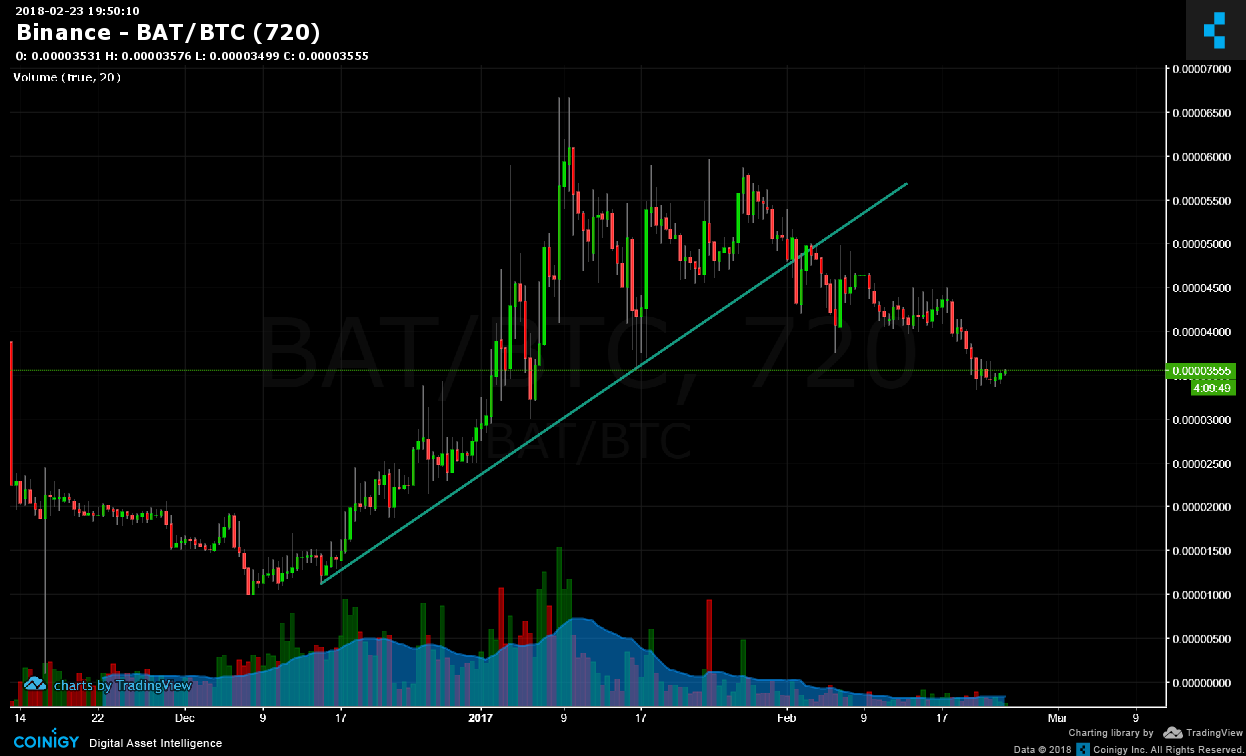
An uptrend is when the 2nd point on the line is higher then the first point, indicating that the price is on a positive trajectory.
The uptrend line must have 2 points touching the line, but for it to be a VALID up trend, it must have at least 3 points touching to confirm the trend.
Uptrend lines act as support and indicate that net-demand (demand less supply) is increasing even as the price rises. A rising price combined with increasing demand is very bullish, and shows a strong determination on the part of the buyers. As long as prices remain above the trend line, the uptrend is considered solid and intact. A break below the uptrend line indicates that net-demand has weakened and a change in trend could be imminent.
Down Trends
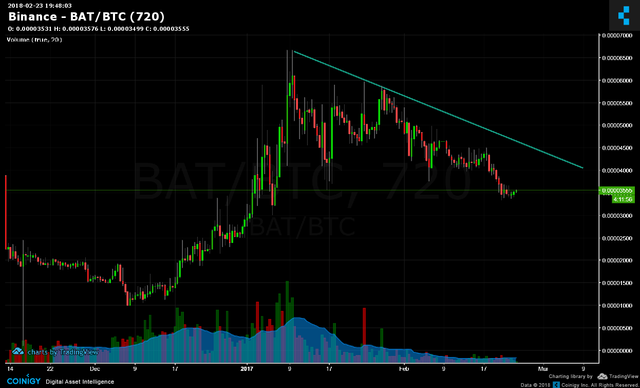
A downtrend is when the 2nd point on the line is lower then the first point, indicating that the price is on a negative trajectory.
The downtrend line must have 2 points touching the line, but for it to be a VALID up trend, it must have at least 3 points touching to confirm the trend.
Downtrend lines act as resistance, and indicate that net-supply (supply less demand) is increasing even as the price declines. A declining price combined with increasing supply is very bearish, and shows the strong resolve of the sellers. As long as prices remain below the downtrend line, the downtrend is solid and intact. A break above the downtrend line indicates that net-supply is decreasing and that a change of trend could be imminent.
Line Angles
The angle of the Trend line is also a very important factor. For long term sustainability, a long term investor would look for a shallow line of support showing gradual and sustained growth over a long period of time. But a short term investor looking for rapid rewards would look more for a very steep angle.
As we can see on the above chart, the growth was quite rapid, but this level of growth is generally unsustainable, hence why it broke below the trend and reversed into a downtrend. We can also see this in a Fibonacci Retracement in later episodes.
Conclusion
Trend lines are an important tool when looking for areas of support and resistance. But if they are used improperly they can lead to false signals. Anyone can choose any points they like to plot a line and interpret it in their own special way. No one chart or tool is correct, as well as the age old saying "Past performance does not determine Future performance"
Its good to get these bite sized, easy to read info posts. My old brain has trouble taking it all in at once. Thanks for posting.
https://steemit.com/aceh/@sayfulbahri/keutamaan-menghafal-hadist-478f5918ba872
Post nice
Wau semangat cantik guru pendidikan.
Itu sangat menarik, dan lol sekali bagi saya padahal postingan ini sungguh sangat bermanfaat dan bermakna jika di baca sampai habis. Hehe
@gohba.handcrafts
sorry mate, I can't read that, but thank you for taking the time to comment.
meaning this post is meaningful if in understand
Looks so awesome! thanks for sharing! i will start following your exciting posts! Checkout my posts as well
I'm thinking that Miss Behavin is getting a lot of peoples attention haha Interesting post also, always good to have more information at hand on trends which is not a strong point of mine.