JAPANESE MODEL IN JAPAN TRADECOIN
- WHAT IS THE JAPANESE CHART?
What is a candlestick chart?
It is a tool used in ancient times used by the Japanese to trade rice
Steve Nison discovered this secret when working with brokerage firms in Japan. He further researched and later wrote books on this technique and disseminated it in the West. This technique became popular in the 1990s. What is a candle chart?
The picture below will be clearer
Candlestick charts can be used on any time frame, either 1 day, 1 hour, 30 minutes - whatever time frame you want. A candlestick chart is used to describe the price action within the time frame we have chosen
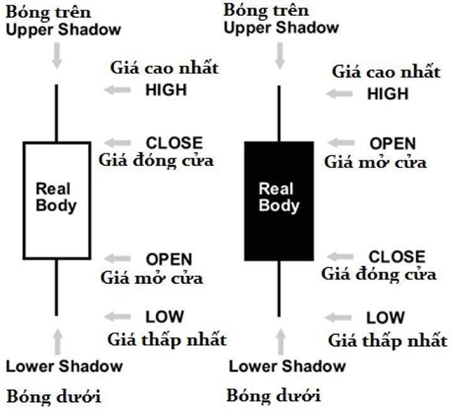
Candlestick charts are formed from the opening, highest, lowest and
closure of selected period period
• If the closing price is above the opening price, the market is represented by a rising candle (the example is white candles)
• If the closing price is below the opening price, the market is represented by a candle (the example is black candlestick).
• White body or black body is called "real body or body"
• The outer part of the upper and lower body is called the "shadow ball"
• On top of the upper shadow is the highest price
• Bottom of the lower shadow is the lowest price
- CANDLES AND CANDLES
Candlestick
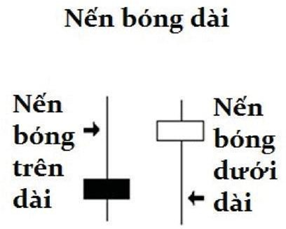
Like human beings, candlestick charts come in different sizes. For example, the long candlestick represents a strong buying or selling force. The longer the body, the stronger the buying and selling force. This means that the buy or sell side is controlling the market at the moment. Meanwhile, the short candle represents a weak buy-sell.
Candles:
The upper and lower shadow of the candle showed signs of trading
Candlesticks showed high prices during the session, while the shadow below shows low prices
Candlesticks with long shadows showed much volatility, out of open price and closed
If a candle has a long upper shadow and a shorter candlestick, it indicates that the buying side has tried to push it higher but for some reason the sellers have jumped in and pushed the price down again, door closer to the opening price
If a candle has a long lower shadow and shorter shadows, it shows the sellers controlling the market and pushes the price down but for some reason the buying side has jumped and pushed the price up again, causing Closing price close to opening price

3.3 BASIC BASIC TYPE OF USE
- Spinning Tops - Spinning Tops
Candlestick pattern with upper and lower shadow, small body is called Spinning
Tops. The color of the body does not matter
This model demonstrates that no decision has been made between the buy and sell side
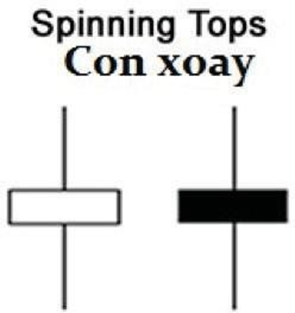
The small candlestick shows small volatility from the opening price to the closing price, while the candlestick shows that both the buy side and the sell side have struggled with each other but neither side wins.
Even when the market opened and closed with little change in price, in fact the price has fluctuated sharply in this session. Neither side buys and sells side gains the advantage, so the result is that the two sides look like a tie. If the spinning model appears in the downtrend, it may indicate that not many people want to sell to push prices down. Again, the possibility of a reversal could occur. If the spinning pattern appears in an uptrend, it may indicate that there are not many more people willing to buy to push up the price again and the possibility of a reversal reverses. Possible Marubozu Candles Mazuboru is a candle without candles that only long candles, that is the candle only open price and closing price. At this point, the opening and closing prices are equal to the highest or lowest prices.
Two types of Marubozu can be seen below:
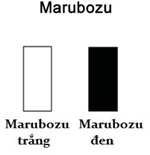
- Mazuboru rose (white candlestick) did not have the shadow on the lower shadow because the opening price was the same as the lowest price, while closing price was the same as the highest price. This is a bullish candle pattern, showing the buy side has completely controlled the session. It is usually the first sign of a price rally or a sign of a reversal from falling to rising
- Mazuboru dropped (shadow black body) without the shadow on the lower price because the opening price was the same as the highest price, the closing price was the same as the lowest price. This is a strong bearish candle, showing the sell side has completely controlled the trading session. It is usually the first sign of further price declines or signs of a reversal from rising to falling
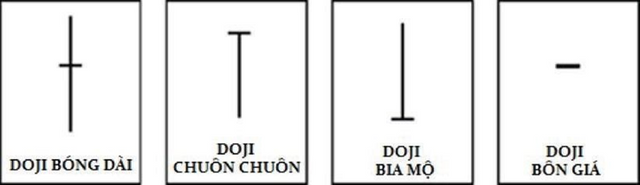
- The Doji candlestick pattern is a candlestick pattern where the closing price and the opening price are the same or nearly the same, ie the candlestick will be very small, just as a thin line if you look at the chart.
The Doji candlestick pattern shows indecision or the struggle between the buying and selling sides (somewhat similar to Spinning Tops). Prices moved up and down during the session but closed very close to the open
Neither side of the buy and sell side can take control, and the result is mutual harmony, which results in Doji candles.
There are 4 kinds of special Doji candles. The length of the different upper and lower shadows and the resulting doji candle may look like a cross or a reverse crossbow ... There are some models below as follows:
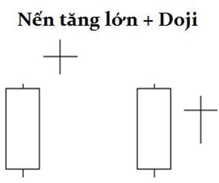
When a doji candle appears, you need to pay particular attention to the previous candle.
If a Doji tree appears after a series of rising candles with long body candles (like Marubozu candles), the sign that the doji bring may be the weak and weaker side. As prices continue to rise, more buyers are needed, but it seems that no one else is. The sellers are jumping in and are likely to push prices down
If a Doji tree appears after a series of falling candles with long body candles (like Marubozu candles), the sign that the doji bring may be the weak and weak sellers. As prices continue to fall, more sellers are needed, but there seems to be no more. Buyers are jumping in and are likely to push up prices
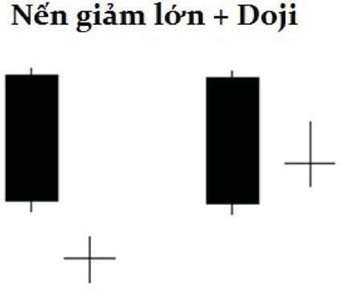
While the decline has slowed down by the lack of support for the side, the side need to show strength by confirming the reversal. A rising candle with a closing price above the opening price of a previous candle will be a reversal.
- CANDLES MODEL 1 CANDLES
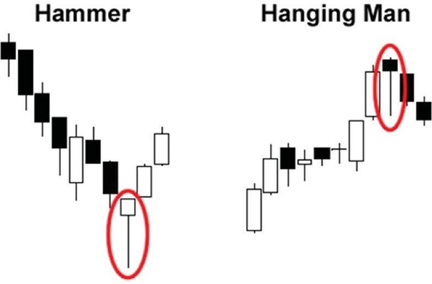
Hammer and Hanging Man
These two models look exactly the same, but actually it is different based on the previous price movements. Both models have small bodies, long lower shadows, very short shadows or almost nonexistent.

Hammer-hammer model - is a bullish reversal pattern, occurring in a downward trend. This candlestick pattern looks very much like a nailed hammer with the handle below it.
When prices are falling, the hammer candle pattern shows that the bottom is approaching and the price may rise again. The long lower candle indicates that the sellers have pushed prices lower but the buyers have been able to resist the selling pressure and push the price up again, making the price close to the opening price. The hammer in a downward trend that you place a buy order is a mistake. You need more signals to confirm the increase before you place the order
An example of a security confirmation is that you can wait for a candle to rise again after the Candle Tree pattern. Identification Condition:
- A candle with 2-3 times the length of the tail
- The ball is small or not
- Body on the top of the tree
- The color of the body does not matter
Hanging man pattern - a reversal pattern of falling candles, usually appearing at the top of a rising trend or in a strong resistance zone. When prices are rising, the Hanging Man pattern appears, suggesting that the sellers are starting to jump in and out of the buy side.
The long shadow showed that the sellers pushed prices down during the trading session. Buyers pushed prices back up but prices pushed up just near the open price session
This warned that the buyout was no longer enough to keep up momentum. Condition of identification:
- A candle with a lower shadow is about 2-3 times longer than a candle
- The ball is small or not
- The candlestick is located at the top of the candle
- The color of the body is not important, but if the black body (candle drops), the ability to decrease will be stronger than white body (candle increase)
Inverted Hammer and Shooting
Star).
These two models look similar. The only resistance between them is the one in the down trend and one in the up trend. These two types of candles have small bodies, long upper shadows and almost or no shadows
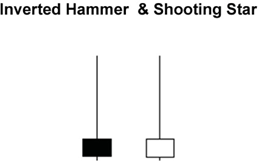
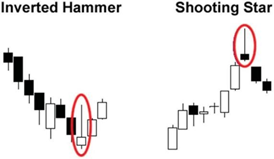
Inverted hammer pattern occurs when the price is declining, indicating the possibility of a reversal. Its long shadow shows the buying side trying to push up prices. Meanwhile, sellers are still selling pressure
Fortunately, the buy side is still strong enough to keep the price close to the opening price, ie the price can not continue to fall as the previous trend.
This shows that when the sellers are no longer able to push prices down means that who wants to sell is already sold out and the market no one wants.
sell again. If no one wants to sell anymore, who will? The answer is buy phe
The Shooting Star model is a reversal pattern with the same structure as the reverse hammer, but it appears when prices are rising. This indicates that the sellers are beginning to prevail against the buy side in the uptrend and prices may fall back.
- CLASS 2 MODEL
Candlestick Patterns - A bullish pairing pattern is a pair of candles that signals a price increase. This pattern occurs when a falling candle occurs, but immediately after that a very large candle. The rising candle after "completely submerged" the candle down front. This means that the buy side has decided to push up prices after a period of downtrend or sideways.
In addition, the pattern of sinking - bearish engul fi ng pattern - in contrast to the model of submergence. A falling pattern occurs when a rising candlestick is followed by a large drop, which completely engulfs the previous candle. This means that the sellers have taken full control and a sharp decline may occur
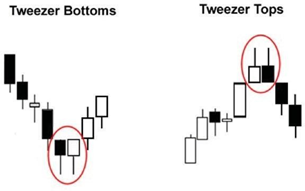
Double Top (also known as Tweezer Top) and Double Tweezer (Tweezer Bottom)
Double bottom double pattern is the reverse pair pattern. This pattern usually occurs after a rise or fall, indicating the possibility of reversing prices. Looking at this model is like tweezers with two equal rods
The double bottom - effective double bottom model has the following characteristics:
• The first candle in this pattern is in the direction of the price trend going. If prices are rising this will be an upside candle
• The next candle will go against the price trend. If prices are rising then this will be a down candle
• The candles of these two candles must be equal in length. Tweezer tops have the same shade. Double bottom (tweezer bottoms) have the same shadow

- CLASS 3 MODEL
Morning Star and Morning Star pattern are the three candlestick patterns that you often encounter at the end of a trend. These are the reversible models that you can identify through the description below (describing an example of an afternoon star model):
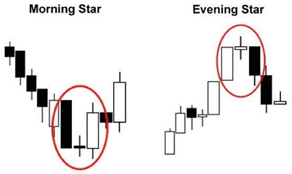
- The first candle in the three candlesticks is a candle, because the current trend is bullish
- The second candle is a small body, indicating that the market may be hesitant. This small candlestick may be an up or down candle 3. The third candle is a candle that confirms a trend reversal, so it will be a candle. The characteristic of this candlestick is that its closing price is below the mid point of the first candle
(similar to the Morning Star model)
Three White Soldiers - Three Black Crows

The pattern of 3 male soldiers is a pattern of three candlesticks rising in a downtrend, indicating a reversal occurred. This is one of the strongest models, especially if it appears after a long downtrend and a short sideways. The first candle in this cluster is considered a reversal candle. It shows that the downtrend or the sideways trend is over
For this pattern to continue, the next candle will be larger than the previous one on the candlestick. In addition, this second candle will have a closing price close to its highest price, ie it will almost or not have the upper shadow
The pattern of 3 soldier soldiers will complete when the last candle completes with almost the same size as the second candle. The candle will also have small balls or no candles.
The pattern of three crows is the opposite of the model of three soldiers. This pattern consists of three falling candles in an uptrend, showing a reversal.
Similarly, this model will have the first candlestick is candlestick, the second candlestick will be larger than candlestick 1 and almost or no candlestick. Finally, the third candlestick will be about the same size as candle 2, and also almost or without shadows - CLASS 3 MODEL
Three Inside Up - Three Inside Down
Because I can not find the Vietnamese equivalent, I keep the English name for these two candlestick models
The Three Inside Up pattern is a reversal pattern that usually appears at the end of the downtrend. It shows that the downtrend could be over and the uptrend has started. For a proper three inside up, note the following:
The first candlestick is usually at the bottom of the downtrend, showing a picture of a long falling candle. 2. The second candle is a rising candle, touching the middle of the previous falling candlestick.
3 The third candle needs to be closed above the first candle to determine that the buy side has strengthened and breaks the downward trend.
In contrast, the Three Inside Down model will be at the bottom of the uptrend. It shows that the uptrend may have ended and the downtrend started. The description of the Three Inside Down model is exactly the opposite of the description of the Three Inside Up model

The Three Inside Up pattern is a reversal pattern that usually appears at the end of the downtrend. It shows that the downtrend could be over and the uptrend has started. For a proper three inside up, note the following:
- The first candle is usually at the bottom of the downtrend, reflected in the image of a long falling candle
- The second candle is a rising candle, touching the middle part of the previous candle
- The third candle needs to be closed above the first candle to determine that the buy side is strong and breaks the downward trend.
In contrast, the Three Inside Down model will be at the bottom of the uptrend. It shows that the uptrend may have ended and the downtrend started. The description of the Three Inside Down model is exactly the opposite of the description of the Three Inside Up model