related:
"This graph shows cumulative distribution of the Voting Power.
It enables to see the total Voting Power of each level."
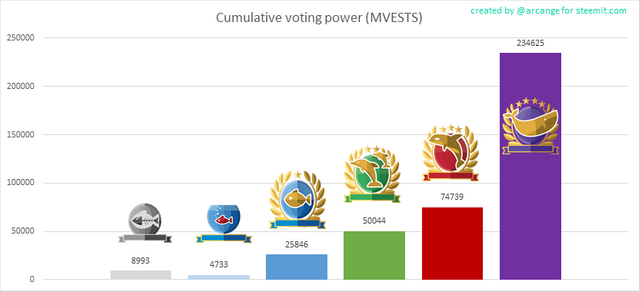
(source, courtesy of @arcange)
well, it certainly illustrates the point made recently in here:
“All fishes are equal, but some Fishes are more equal than others.”