DOW update 24.01.18
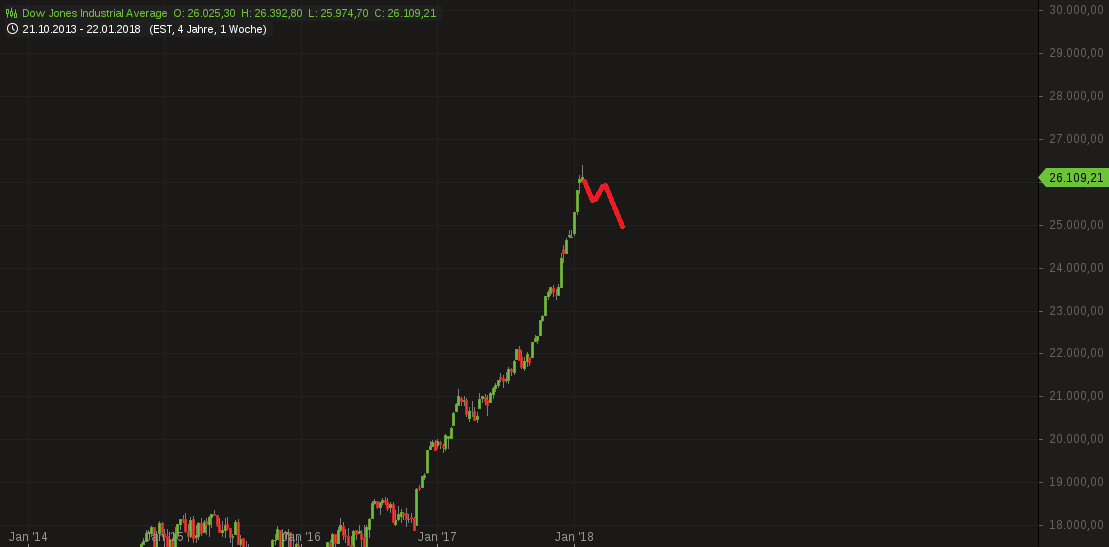
No, this is not the BTC chart, but it looks equally parabolic:
It is the Dow Jones Indutrial Average chart showing the most hated rally in human history.
If you did not manage to open a long trade @ 19,000 or 20,500 you were basically locked out of this market for months now.
Not a single good entry point was given since April 2017. Not a single correction was bigger than 600P in this highly overbought market.
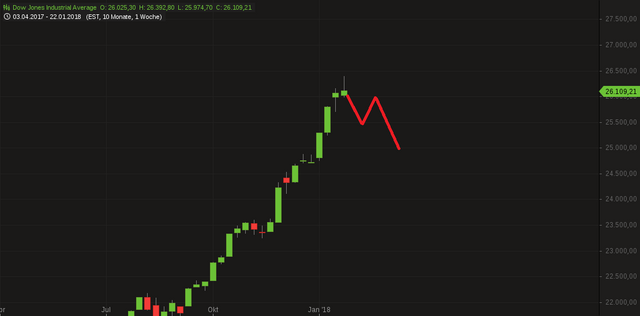
BUT: this cannot last forever... A bigger scale correction is long overdue and could have started today. If this weekly candle turns red until friday evening, there is a high chance of a 1400P correction approaching. Finally, you could say...
But the weak USD will likely push it to new alltime-highs right after this correction is done... I am looking to short this drop and buy the dip afterwards.
.png)
If you think this to be useful information:

.png)
Feel free to use and share my charts, but please mention me, @ew-and-patterns as the author. Otherwise it is considered plagiarism and I will flag you and advise my friends to do the same.
.png)
MUST READ!
DISCLAIMER: This post / analysis serves general information purposes only. I am not, and never will be a financial adviser. The material in this post does not constitute any trading advice whatsoever. This is just the way I see the charts and what my trading ideas (from my personal experiences) are. I use chart pattern and Elliott Wave analysis for my trading ideas.
For full disclosure: The author of this post is holding positions in this market at the time of this post. Please conduct your own due diligence, if you plan to copy anyones investment decisions!
If you make any trades or investments after reading this post, it is completely in your own responsibility. I am not responsible for any of your losses. By reading this post you acknowledge and accept to never hold me accountable for any of your losses.
Please consider leaving a comment, like or resteem, if this post entertained you or helped you see things differently...
Have a nice day :-)


I believe the USD is in trouble and the stock market's inflation is a reflection of this impending calamity.
Everyone is expecting stocks to dump during the next crisis, but it looks to me that the USA is facing a currency crisis that will begin with a massive rout in the bond markets.
Even the Davos billionaires are intuitive sensing that something big is brewing behind the scenes.
The thing is everyone knows its brewing, but nobody knows for sure when the volcano will erupt.
If you look at human history, we faced similar situations in the past, but the tipping point where everything collapsed, mostly happened a few YEARS AFTER everyone perceived "something is not right here!"
When 2s and 10s cross (Treasury notes) History says 12-18 months until selloff
@techwizardry Time for joining or strenghtening the nearest social/alternative local currency network we know of (apart from the cryptos, which will suffer too during a general economic collapse ;-)).
I love the set up !! Down hard ... up harder ... then down HARDEST
Thanks for the update on the DOW great to see the US index on Steemit.
I agree with you on the USD weakness driving the move higher for US stocks of late. However something interesting happened today that tells me that the open comment on the shift from the US treasury on the benefits of a weaker Dollar has actually scared stocks instead of fueling it higher.
What the market may be actually finally worried about is a repeat from 1987 as you can see Stocks where on a tear until the weakness in the Dollar was too much and their was crash. So this needs to be watched certainly.
The other issue that will create a serious reversal in US stocks and bring the economy is Interest rates. The key target is 10 yr Bond yields that is creeping higher each week spelling trouble for the indebted US economy.
2018 will be an interesting year for events on the market.
PS The charts are from Zerohedge.com
Cheers
Outstanding analysis work with graph chart. Great opinion you shared. Thanks for sharing
Enjoyed your content, and I agree when a 600p climb comes a fall can too be expected in equal manner.
nice and beautiful post you have here,thank you for contributing such a beautiful article to this community,wish I had enough sp,i would give
good information, but I can not advance, this post, because my sbd is not enough, 😥
Content and work analysis with graph is jux amazing
When the BTC and co is down community pays more and more attention to not-crypto investment. Isn't it a rise of trader' job? So much people trading now.
My follow you and up vote
Your up vote me https://steemit.com/story/@edysukmawan/kisah-kerinduan-bilal-bin-rabah-kepada-rasulullah-beb630bca5d89 😊