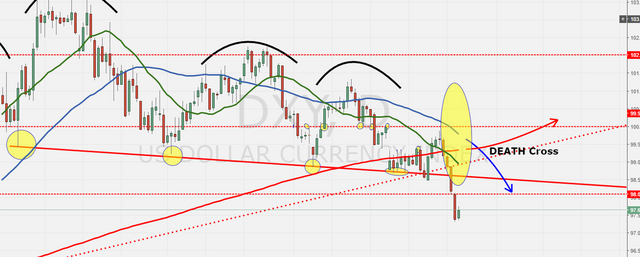
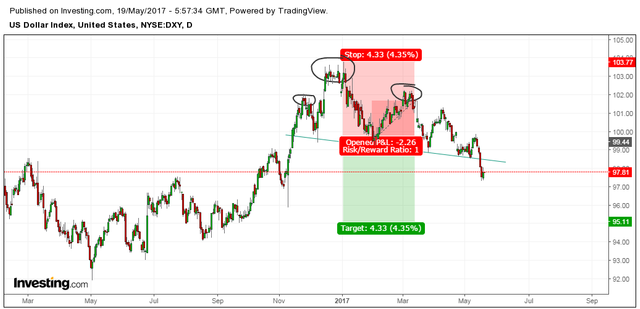
WEAK DEATH Dollar (DXY) and WEAK equities bounce.

The Maestro!
www.themaestroway.com
7 years ago in #dollar by themaestro (51)
$0.81
- Past Payouts $0.81, 0.00 TRX
- - Author $0.67, 0.00 TRX
- - Curators $0.14, 0.00 TRX
I didn't know what a Death Cross was, so I looked it up:
http://www.investopedia.com/terms/d/deathcross.asp
The link has a video explaining it as well as more info.
"What is a 'Death Cross'
A death cross is a crossover resulting from a security's long-term moving average breaking above its short-term moving average or support level. It is so named due to the shape created when charting the activity and its association with a downward market trend. As long-term indicators carry more weight, this trend indicates a bear market on the horizon and is reinforced by high trading volumes. Additionally, the long-term moving average becomes the new resistance level in the rising market."
The DXY is a huge HEAD AND SHOULDERS formation with projection to about 95 according to my pattern rules.

this should be good news for metals, but we've heard about that so often, I will believe it when i see it
Right on!
Thank you for chart Maestro!
Good Insight
I looked at your website to find deeper analysis, but did not see one. Id love to hear the views of an expert chartist on what this means. Until the central banks let go it seems like chart analysis for stocks is not important, but for the dollar this does not look good.
Website has been running for maybe a week.
That is quite the telling chart there. Wonder who will control the narrative when the bubbles finally pop.
Awesome chart.
meaning you don't think the equities bounce will last?
Dollar going lower doesn't mean equities follow. Equities are the new bond. Until not...
Nice charting
Good work Maestro, thanks for sharing.
Well charted. I am curious to see how the banks handle this situation.
this is what they want, a weak dollar.