DOGE/USD & DOGE/BTC Price Analysis: April 24/2019 AT New Bottom
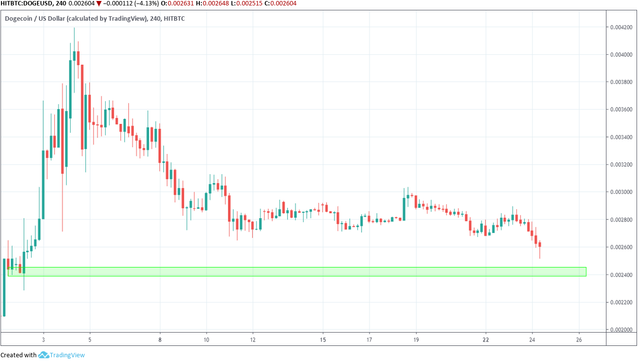
On Apr 4, 2019, the price of Dogecoin (DOGE) reached a high of $0.0041 and 85 satoshis. It has been gradually decreasing since.
Prices continued dropping in both dollars and bitcoins after Apr 22. At the time of writing, Dogecoin was trading near $0.0025 and 46 satoshis.
DOGE/USD & DOGE/BTC Prices: Apr 7 – 24 Will prices continue dropping or will a reversal bring gains back to Dogecoin?
Let’s find out!
Dogecoin (DOGE): Key Trends And Highlights For April 24, 2019
- Dogecoin reached a high on Apr 4.
- It broke down from the support line on Apr 24.
- The breakdown occurred on average volume.
- There is support near $0.0024 and 45 satoshis.
Previous Movement
Tracing these lows gives us a horizontal support line:
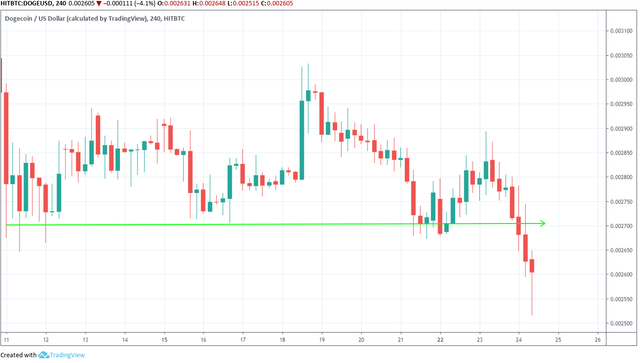
On Apr 24, the price broke down from this support line. If this was a false breakdown, Dogecoin may rebound above the support line in the near future. However, a valid breakdown might lead to more significant and rapid losses.
Breakdown Volume
In order to test the validity of the breakdown, we need to take a look at volume.
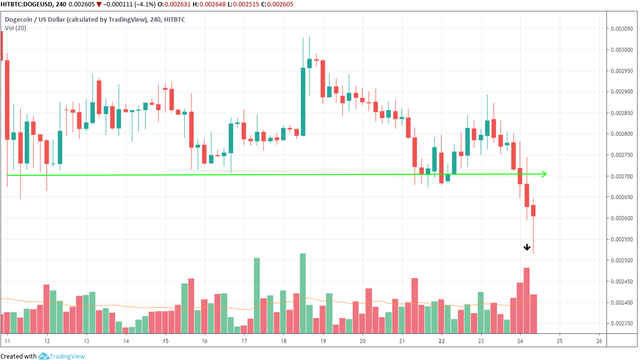
We can see from the graph that the breakdown occurred on average volume. This drop might have been a response to the BTC price decrease we saw on Apr 24. Thus, we might be looking a at a false breakdown.
If this is true, Dogecoin may soon rebound above resistance and see the gains we predicted in our Apr 22 analysis. However, first it needs to initiate a reversal.
Possible Reversal
To determine how low prices will go before a reversal, we integrate support areas into this section of the analysis.
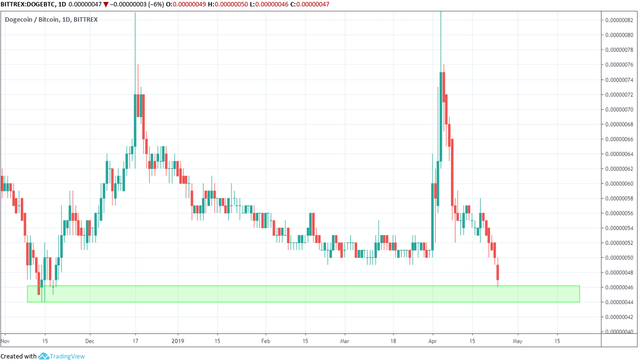
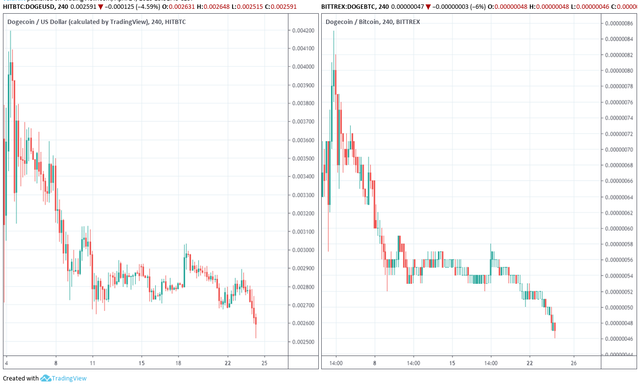
DOGE/BTC
DOGE/USD
The closest resistance area is found near $0.0024 and 45 satoshis. We believe that the price will eventually reach these areas and then rebound above the support line traced above.
Summary of Analysis
Based on our analysis, the price of DOGE is likely to decrease and reach the support area outlined below. We expect that in the future the price will move above the support line of the first section.
When do you think DOGE will begin a reversal? Let us know your thoughts in the comments below!
Disclaimer: This article is not trading advice and should not be construed as such. Always consult a trained financial professional before investing in cryptocurrencies, as the market is particularly volatile.
Posted from Bittabi Bittabi.com : https://bittabi.com/doge-usd-doge-btc-price-analysis-april-24-2019-at-new-bottom/