Steem: An attempt to show improved distribution to content authors over the past year
A look at reward distribution between authors and the participation in content production over the past year.
tl;dr: Good news, I think!

source
The initial idea of this data grab, based on numerous requests, was to take a look at pre and post hard fork author rewards to see if the EIP had changed the distribution in any way.
Before I get to the data, a reminder of what is stated in the Steem whitepaper:
The actual distribution will depend upon the voting patterns of users, but we suspect that the vast majority of the rewards will be distributed to the most popular content.
... if we order some large collection by size or popularity, the second element in the collection will be about half the measure of the first one, the third one will be about one-third the measure of the first one, and so on.
... if we have a million items, then the most popular 100 will contribute a third of the total value, the next 10,000 another third, and the remaining 989,900 the final third.

The quotes and chart above are all taken from page 13 of the Steem Whitepaper.
My short interpretation of the above is that it is expected that the vast majority of content producers will earn little compared to the few at the top. I've included the above to make clear that this is the game and it's unlikely that however we choose to slice the cake, a short head and long tail is still likely to exist.
Comparing author rewards over the past year
To take a shot at this, I've picked 5 the following data ranges and summed up each authors vesting rewards. The liquid rewards (and curation rewards) are ignored in this post.
01/25/2019 00:00:00 - 01/31/2019 23:59:59 -- last week of January 2019
04/24/2019 00:00:00 - 04/30/2019 23:59:59 -- last week of April 2019
07/25/2019 00:00:00 - 07/31/2019 23:59:59 -- last week of July 2019
10/25/2019 00:00:00 - 10/31/2019 23:59:59 -- last week of October 2019
01/25/2020 00:00:00 - 01/31/2020 23:59:59 -- last week of January 2020
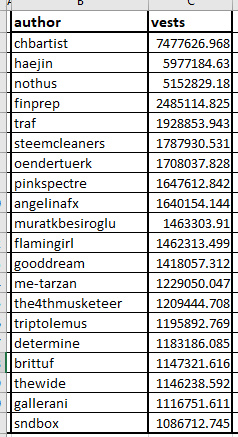
First, a chart that has no right in any publication due to its lack of clarity (you may disagree!) - The vested author rewards for week ending 31st January 2019.

The label on the chart is the total vests for the week above for author 25 - who by my reckoning is somewhere around the end of the head and the start of the tail? The chart for week ending 31st January 2020 shows little difference to the naked eye, and so I've grouped authoring accounts into the buckets below to produce the next display.
Top 10, top 20, top 100, top 500.


Taking the data from Jan 2019 and Jan 2020, the percentage of total vesting rewards has reduced across all the buckets.
The most notable dip in percentage came in the first data range which followed the EIP fork.
The percentage of vests earned by the top 10 and top 20 authors has picked up again in the most recent data set.
Removing @burnpost
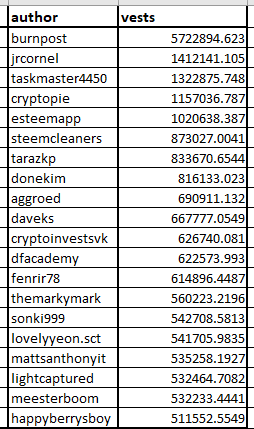
The reason the final statement above is true is likely due to the rise in popularity of @burnpost, which was easily the largest receiver of rewards at the end of January 2020.
All rewards received by @burnpost are eventually burned and so although these vests are not available for authors, I thought it was worth (you may think otherwise) running the numbers again without this account included.
w/b - without @burnpost

Excluding @burnpost, the percentage of vests going to the top 10 authors free to powerdown and cash-out vesting rewards has almost halved.
Whether the removal of @burnpost is meaningful or not is open to debate - the Vests are unavailable - would these vests have previously have been (evenly) spread across authors?
Back to the original data (with @burnpost) and the quote from the whitepaper...
... if we have a million items, then the most popular 100 will contribute a third of the total value, the next 10,000 another third, and the remaining 989,900 the final third.
We don't have a million accounts earning vesting rewards (contributing value?) and .0001% (100/1,000,000) of 6326 (accounts) is just over half an account, and so taking that route doesn't really tell much.
Looking at the total number of vests rewarded and the total number of unique authors receiving them does seem to show a wider distribution (more top authors sharing the first 3rd of value).

The top 165 accounts took (or shared) 1/3 of the author vests in the final week of January 2019, 48 accounts more than in the final week of January 2019.
The number of authors sharing the 'middle 3rd' of the VESTS in January 2020 was less than the number in January 2019, however as percentages, which accounts for the total number of unique authors in each data set receiving vests:

Based on the above, distribution to authors has improved a little?
Cheers
Asher
(10% to @burnpost for the name-dropping extravaganza)
In January 2019, I am assuming that the top 10-20 were mostly all bidbots, whereas I am guessing none are now? So not only has the share decreased, what is up at the pointy end is mostly organic?
I wonder where the top 10 from Jan 2019 now sit in 2020
Not in the top 20 :)
Only steemcleaners exist in each of the 5 week endings I used.
For sure. I didn't want to confuse myself further with bots (took a section out) but yeah, there are far more 'free' vests available now.
Jan 2019
Jan 2020
Dunno about that guy in 7th :)
Thanks!
Am I blind or is there no overlap at all? Besides SC
I think they are the only account to appear. April July October below.
Can definitely see the hardfork difference
And now, to the moon :)
Looking good today at least
Do you see any "new blood"?
Ok. I am one of those people who asked for this data. So first of all, thank you, Asher. I think this puts to bed the controversy if burnpost is actually useful or not. The only thing that remains in the optics of trending, which we can work on constantly with everyone's help and support.
Several days back @smooth @pharesim and I (I was mostly an observer :)) had this discussion whether burnpost is good or bad for the economy. I actually have to organize that discussion as a post (I am slacking). Below was smooth's starting hypothesis :
By logic burnpost is basically #2 and on $1+ SBD scenario it is #1. If that is the case, the obvious question is there must be a positive impact of burnpost on :
I think #1 here is difficult to prove in short term (should be positive by math in the long term), but Asher has proven that #2 is definitely the case on the "head" of the reward distribution, which is what we want.
Thanks for the feedback @azircon. I must admit there are parts of that thread which are beyond me, but I wanted to see if I could find anything that could point to a wider distribution of votes, post the EIP fork.
I'm glad to hear that this goes a little way to showing this :)
!ENGAGE 50
(forgot again!)
@azircon you have received
50 ENGAGEfrom @abh12345!View and trade the tokens on Steem Engine.
Hehe, the name dropping extravaganza!!
That is good news seemingly. Heck, if you say it is, I'm gonna believe it!
Numbers eh, can rework them to your agenda all you like :P
Seems to make sense though, but when you are head down in something for hours on end then maybe the obvious is missed!
Hehe, nah. It looks good. I see no wild manipulation!!
Grand :D
Time for lunch then!
Liquid lunch alert!!! :0)
I am tempted for a few this evening, especially seeing as it is your birthday. This means going outside though, something i have managed to avoid today! :P
It's a good excuse for it!!!
But aye, outside is mingin. I had to take the kids out as they were going stir crazy and it was horrible!!
It is, and i could well make it yet.
The kids should each have been given a poo-stick - round em up!
:D
Seems like a double win for HF - better distribution and chbartist as gone, powered down, good riddance.
There are a few who I'm glad to see out. The other good news is that those eager were able to collect their STEEM at a rather low looking price :)
Well distribution might have increased/improve a bit
It's better than it was if my numerical take on it has any value :)
It has improved a great deal as hidden under those numbers are the changes in the accounts that are getting the Steem.
Lol Some rewards go to burn post and most of the rewards go to turd posts
Turd n Burn!
Lol I can't wait for it to converge in a flaming pile like we used to do on my neighbour's doorstep
I'll make sure to avoid trying to stamp it out
One for Twitterland: https://twitter.com/AIMStockWatcher/status/1227304245793296384
Are there really so few people actively using steem in an author capacity? 12,000 Jan 2019 down to 6,300 in Jan 2020?
Yup, surprising isn't it?
6300 different accounts were rewarded author rewards in vested SP over the final week of January 2020.
Well hopefully with the slow steady rise we will see more activity in the coming months.
I am engaging more with comments, does that make me an author? or is it only my posts that count?
Still trying to figure out these stats.
For this analysis, I looked at the rewards for 'top level' comments or 'posts', as they are more widely known.
What do you mean by ‘top level’ and ‘widely known’ is this the number of followers?
Congratulations @abh12345, your post successfully recieved 0.27534938 TRDO from below listed TRENDO callers:
To view or trade TRDO go to steem-engine.com
Join TRDO Discord Channel or Join TRDO Web Site
@tipu curate
A huge hug from @amico! 🤗
#sbi-skip !trdo
Congratulations @amico, you successfuly trended the post shared by @abh12345!
@abh12345 will receive 0.27534938 TRDO & @amico will get 0.18356625 TRDO curation in 3 Days from Post Created Date!
"Call TRDO, Your Comment Worth Something!"
To view or trade TRDO go to steem-engine.com
Join TRDO Discord Channel or Join TRDO Web Site
Upvoted 👌 (Mana: 10/15 - need recharge?)