Almost Verbatim - DigiByte

DigiByte has enjoyed a spectacular run since March, 2017. Exploding 32,741.21% from March to June, 2017. And then who can forget its rise from November, 2017, to January, 2018, of 1,958.73%?
The world's longest, fastest and most secure UTXO blockchain in existence still has a lot of life left. Granted, 2018 hasn't thus far been the moon trip most of us had planned on. But I'm optimistic that the best is yet to come. Whether today, tomorrow, or next year.
That leads me to discuss the following. Observations gleamed from the past. Or, as W.D. Gann might say, "Looking back from 2018".
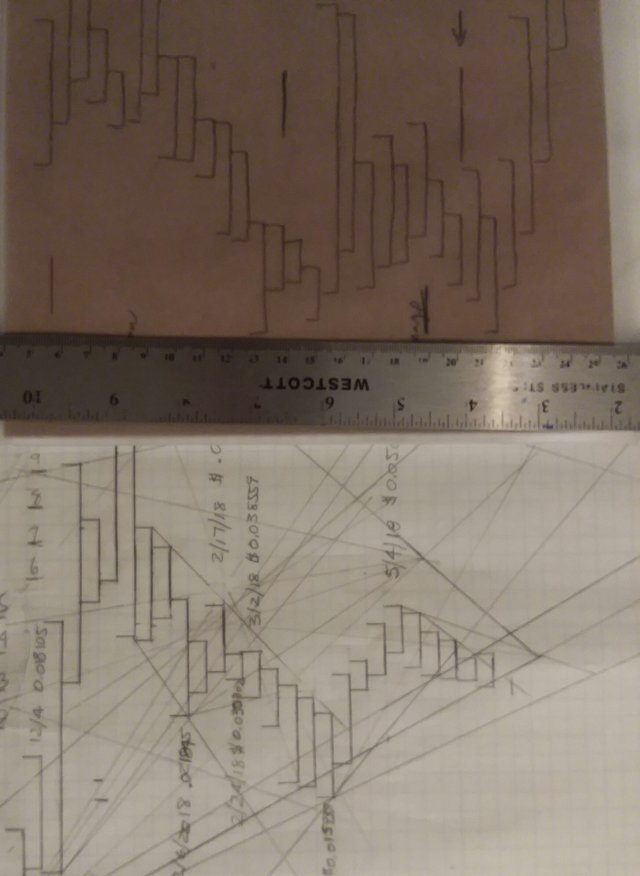
I have posted this chart below several times and wanted to share how identical the past and present Digibyte markets are.

The top chart is the past market action of Digibyte that I have hinted at or explained in the recent past. The bottom chart is the present market.
There are 3 key turning points that are distinguishable in both charts with the fourth upon us.
Number one is the December '17 & January '18 highs which correlate with the top charts Double Top.
Number two, the April, '18 bottom.
Number three, the May high. And,
Number four, the early May high of Number Three descended to the 29th, then Digibyte rallied until June 9th. This rally top and the subsequent downturn of the market is distinct because BOTH charts now reflect the EXACT market action. A higher high and a lower low than the previous price bar.
Now, why is this important?! Because, if the market continues to move similar to or almost verbatim to past market action the time period between now and June 28th, MAY form a bottom. Remember past performance is not an indicator of future performance. However, I personally will precede with caution and let market action dictate whether the trend will change. That is, higher highs, and lower lows.
Also, something I can take away, or learn from this, as in most market cycle type indicators is that:
Markets cycles mimic. Most are not identical.
If the market in the past cycle turned at a particular time frame always proceed with caution in regards to the near present cycle date.
If the market doesn't turn, always look at the next date. Due to "reversals" those past cycle dates can act as accelerators and push the market above/below to the next swing date.
For example, look at the chart showing the past cycle pattern. Pay attention to the price bars to the right of where "in time" we are on the chart below it. If the market doesn't form a bottom then I would anticipate that a failed swing bottom would be an accelerator.
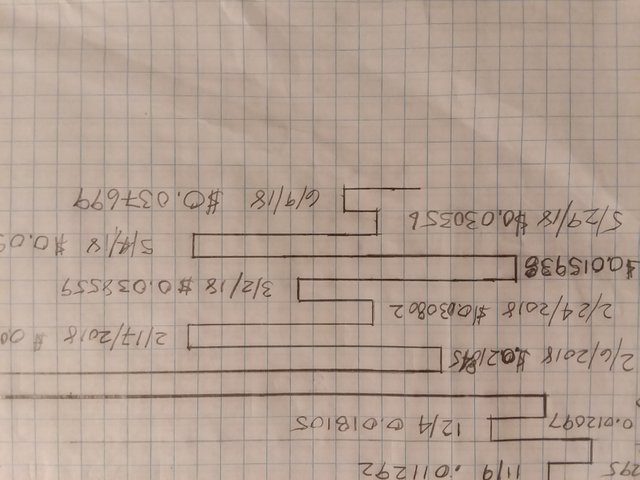
In closing, take a look at the swing chart. Oh yea! All the prices I've referred to above and below is Digibyte/USD not DGB/BTC.
I apologize in advance for the actions of my smartphone transferring the below swing chart the way it has. It hasn't acted so smart the last several days.

DISCLAIMER: This is NOT trading or investment advise. The above is the opinion(s) of the author.
Do your own research. Trading or investing involves risk and you should seek professional financial advise should you seek assistance.

God bless you. https://steemit.com/@biblegateway