In-depht technical analysis of DigiByte (DGB) New high At The end of july! 150% Gains!

Heres my technical analysis of the day, and its about DigiByte (DGB). Lets start with what kind if price action we have been seeing.
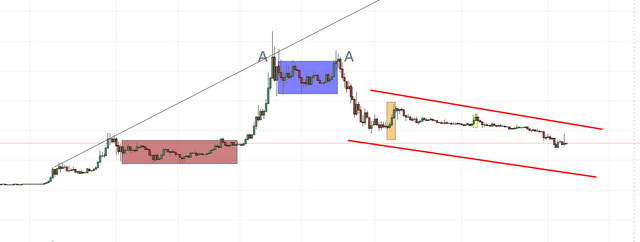
As you can see DigiByte really follows normal structure off stocks/cryptos. DigiByte follows resistant and support levels really well. I have only drawn one on this picture right here, but what we can see is that the ray from the to initial tops creates a resistance level. The red box is where the whales (the proffensianls ) accumulate. The noobs are selling after the top where they probably bought and the whales are esssently getting free DigiByte. then the real surge to the moon starts. Major fomo starts and DGB get higher and higher highs. This is all happening because off a conference presentation by DigiByte at Citibank. We then hit the first high, the whales are then selling all there DigiByte to the noobs in the blue box. then We have the real sell of after hitting a double top which i belive will be broken through in the future. What follows then is the normal deadbeat bounce and more selloff.
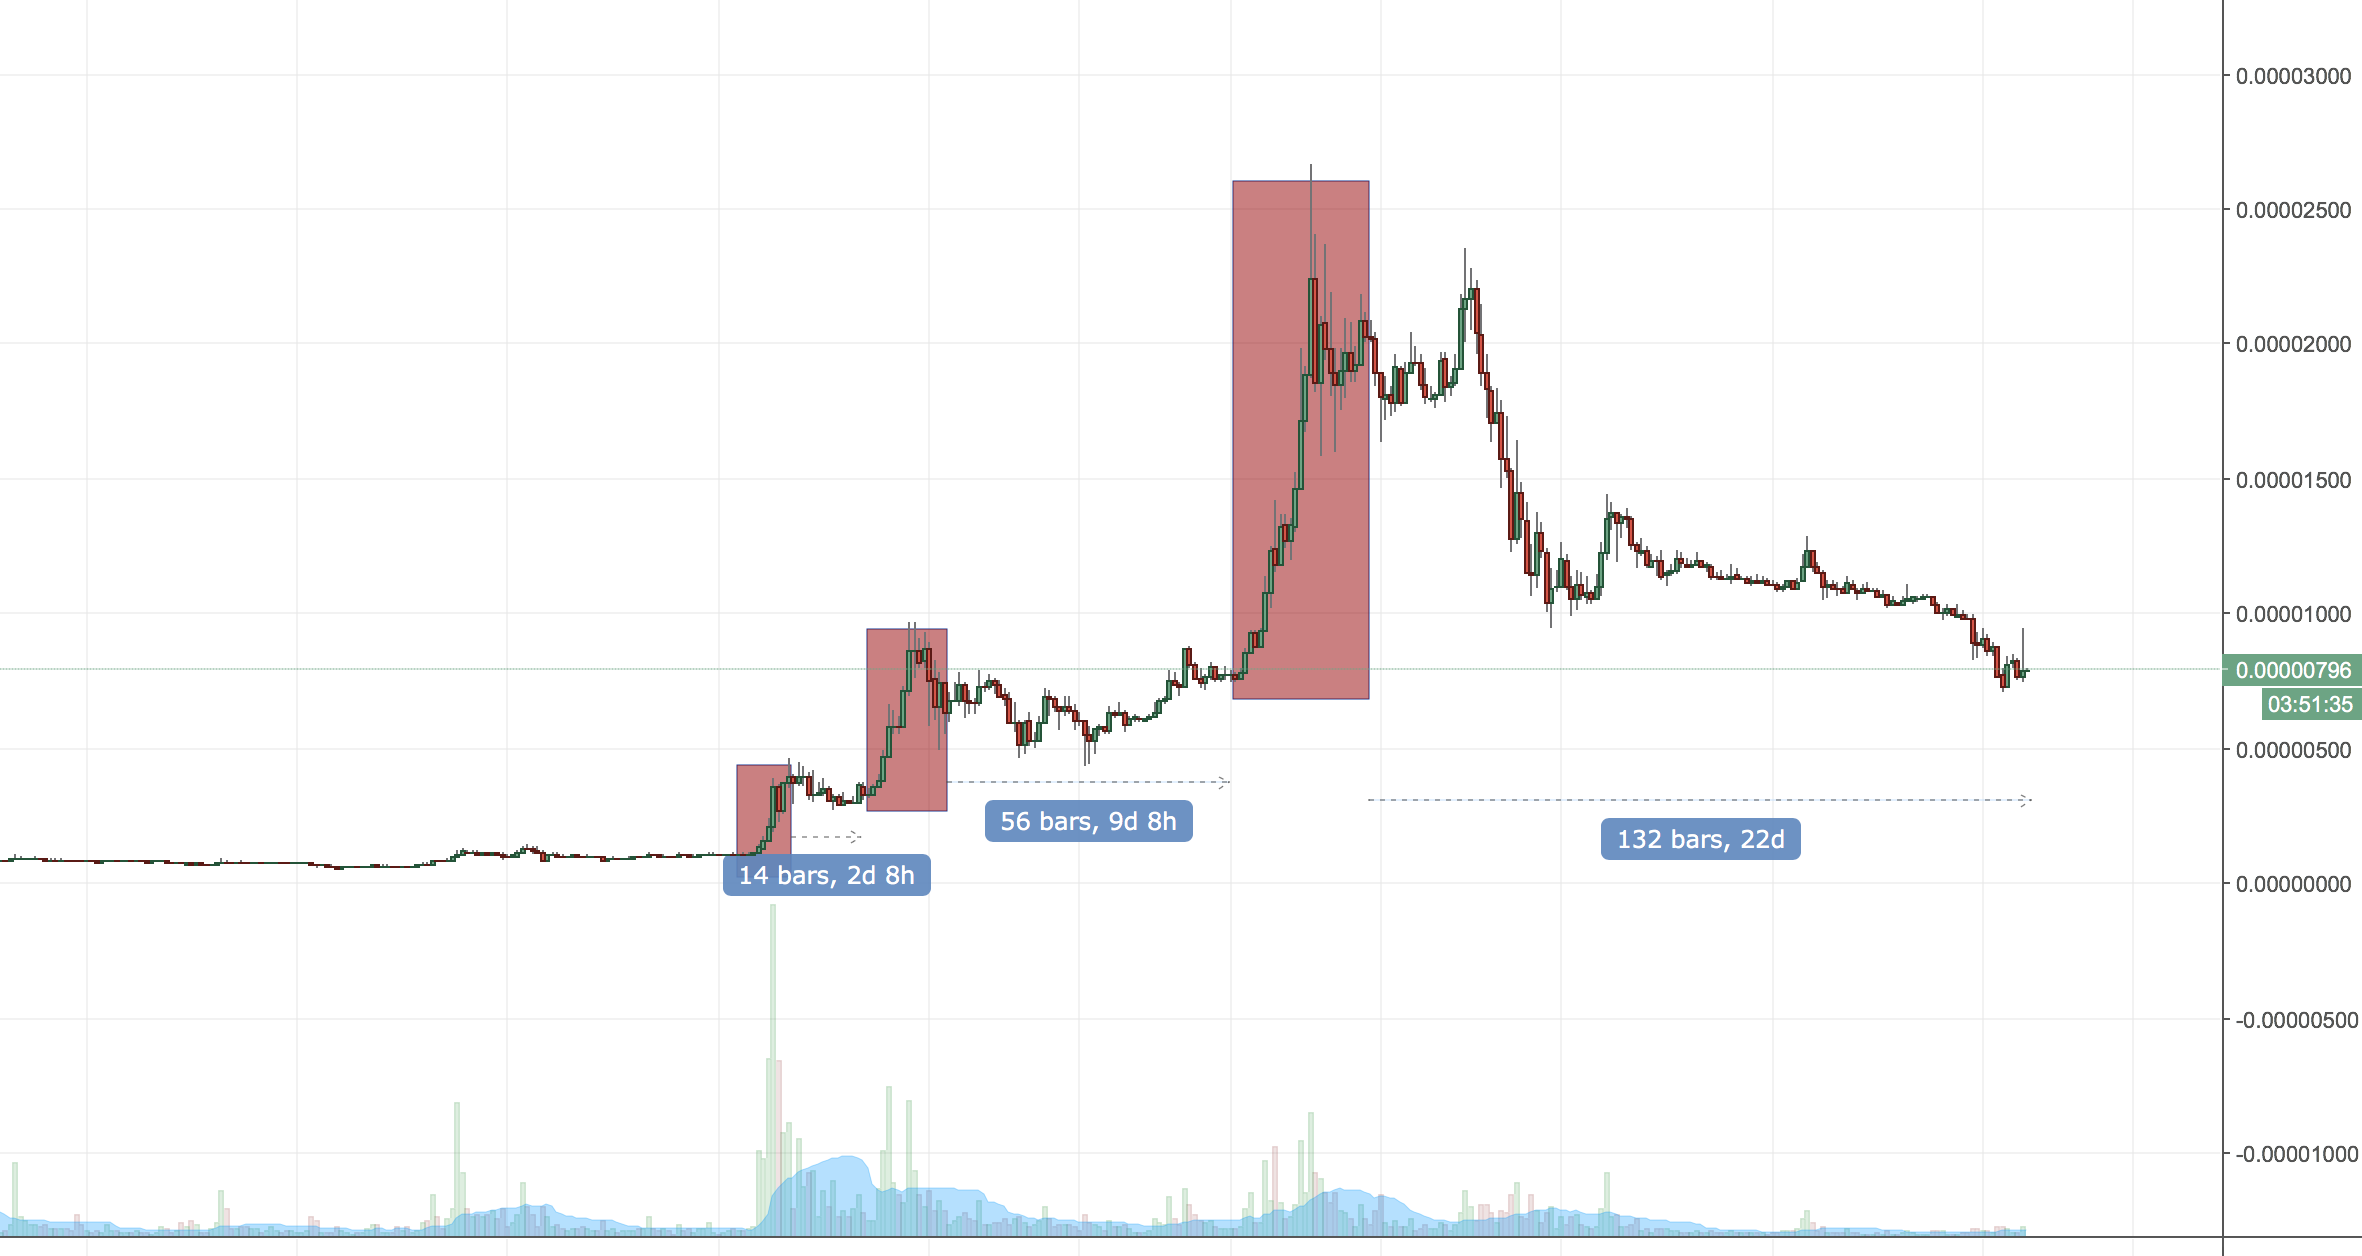
Here we can see that the more DigiByte goes up the longer selloff and accumulation time. This is normal. What we can also see is that DigiByte went from 500 sats to 2500 sats really quickly. It was and still is a little gem. What I can see from this is that it was super undervalued and therefore the mooning is should have and had happened. However, with such surge there will be major sell off. What you can take from this chart is that it will take some time before the next surge in price.
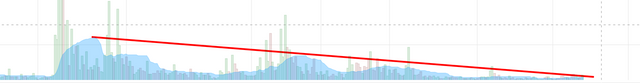
By looking at the volume I belive that we will see a surge in the price soon. It looks like people are silently accumulating. My sense on the volume is that it looks really good.
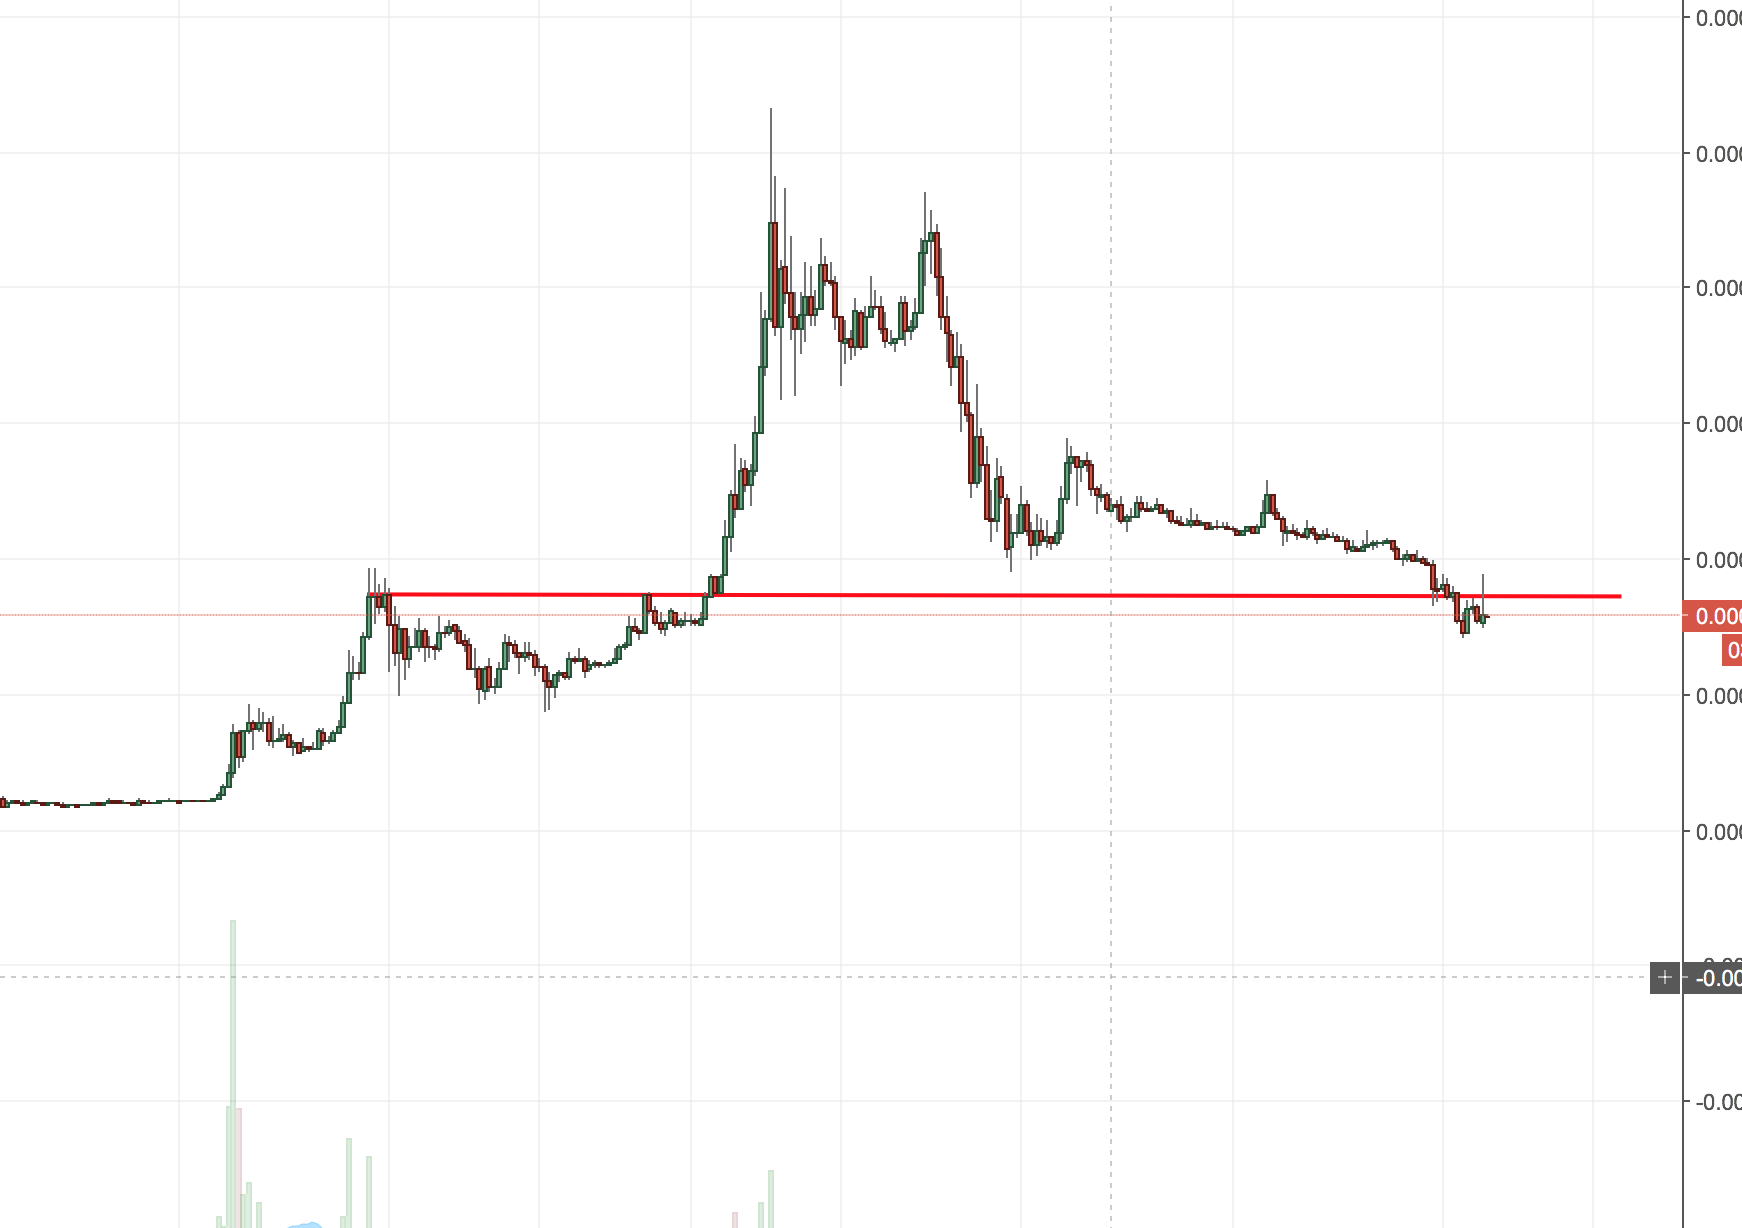
At the same time, what we see here is really negative. It has broken a second major support as you can see, which then indicates more downside. Look for buying when the DigiByte breaks this new resistance.
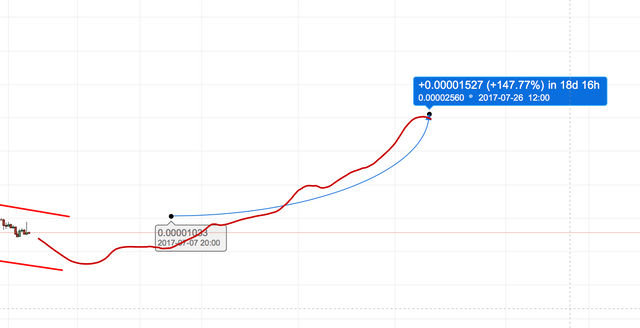
So what will we see in the future? I belive that the price will reach another high at the end of July with the upcoming news in July. Moreover, dont buy right now. With the little bear market right now, DigiByte will also be affected. So we will now see a lower low, so maybe a dip to the 700s. Then in the start of July the price will maybe pump a bit to the 1200s. We will see a accumulation for some days before the major pump. I belive that DigiByte is one of the best coin and you should HODL if you are at a loss right now.
This is todays technical analysis, if you want to see more like this on your coin, suggest it in the comments sections. I will make it:) a new one tomorrow. Bye!
I hope you are right. I was about to get out of some but I'll hold till the end of next month.
Nice blog. I was about to post a similair thread. Though prices might seam inflated for now I don't think they will look like this 2, 3 years from now. This is quite an interesting website I found: https://www.coincheckup.com The site lets you check all there is to know about the team, product, communication transparency, advisors and investment statistics on every crypto. For example: https://www.coincheckup.com/coins/DigiByte#analysis To watch DigiByte Investment analysis.