Mapping : The Beauty of Cartographic Practice
How often do you look at Google maps?
Looking at the Google map has became an imperative thing to do when one tries to get to know about a particular region. The aerial representation contains layers of information that are densely put together to represent the world. Nowadays, Google map provides views that take your exploration further beyond the two dimensional images and labels.
Cartographies are fascinating
Maps are objective but reading a map can be subjective. It is based on one’s interpretations and an extent of one’s cartographic knowledge. In order to practice mapping, one needs to extract necessary information from all the symbols and numbers. Drawing one is based on subjective observations and expressions as well.
Once you start to gather a necessary information from a map, you can start to draw your own map based on the data that you’ve collected to exhibit particular information. By doing so, you can start to see how the city elements start to form a particular relationship.
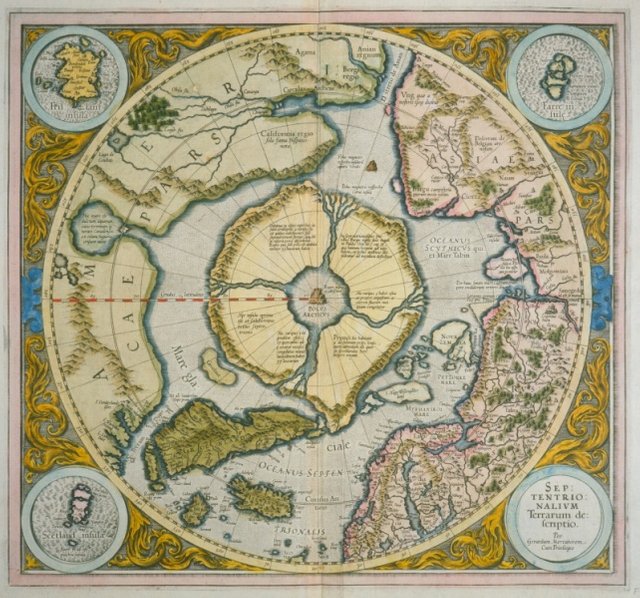
© Fitzgerald Polar Map 1595 via Newberry Library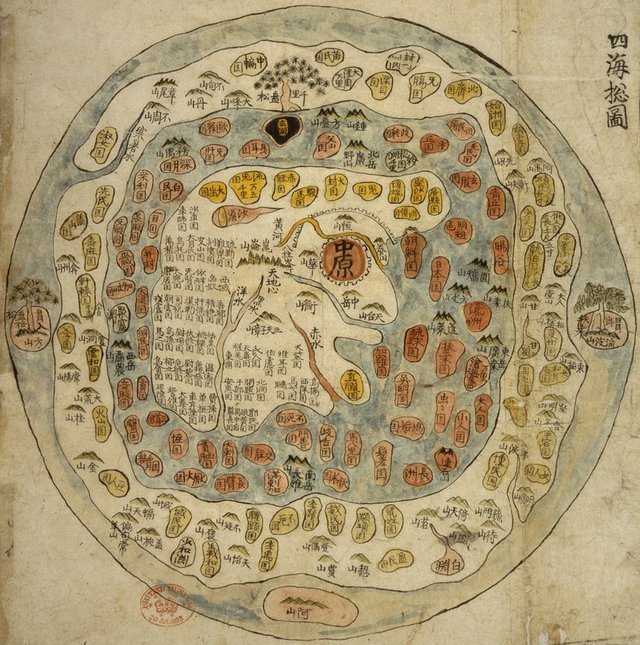
Korea World Map based on Mt. Meru in Asia © Unknown via Mapmania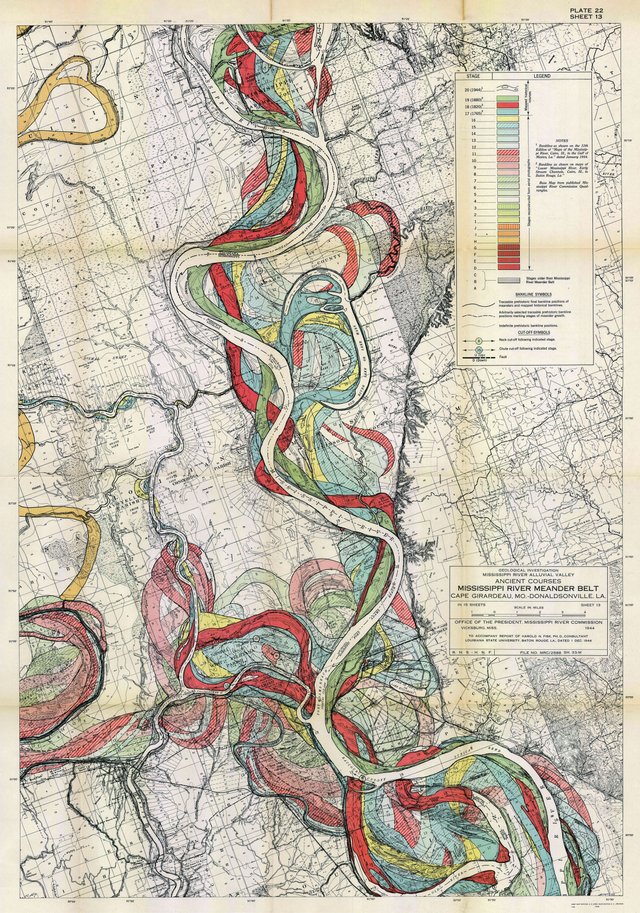
Mississippi River © Fisk 1944 via NASA
Mapping is a creative practice
It is a simple technique but mapping lets you see an existing resource network from point A to B or a particular destination’s relationship to an infrastructural network. Based on the visualized data, you can start to take it to the next step to further propose a new network or element.
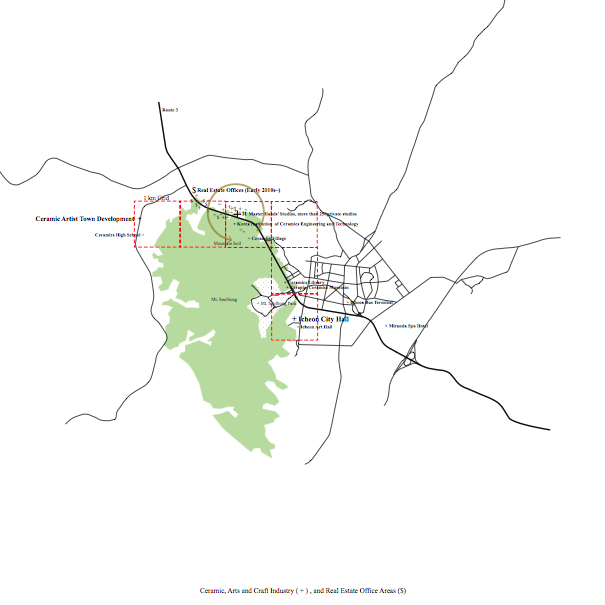
Icheon ceramic village development, S. Korea © mintvilla, 2016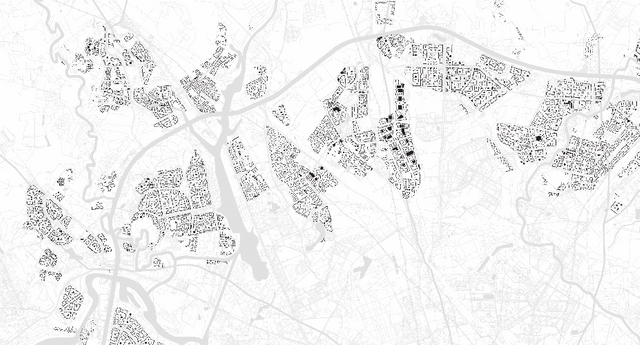
Housings within 10km buffer of MKAD, Moscow © Sexy Beasts TeamWhen you have to work in a scale that requires you to look at more the one neighborhood at once, a mapping software Arc GIS, developed by ESRI, becomes an extremely powerful tool to use. This software allows you to bring in multiple components that make up a city or a town in layers that contain information like topography, value and count for certain factors, longitude/altitude, etc.
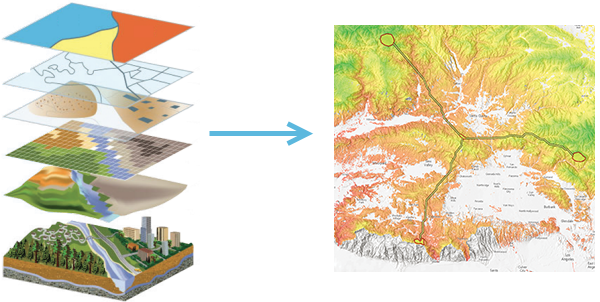
© Arc GISIn the US, the basic set of city GIS layers are often provided by local governments - one can easily download them from intuition websites. The basic ones are such as infrastructure, forest blocks, water bodies, building foot prints, different land uses. There are also websites that offer worldwide GIS data. For a very specific land related information such as toxic land in a military base, past years of estuary disappearance, native flora and fauna growing location, etc can be obtained by a request to a related institution. It is a critical practice to understand a city and evaluate current/potential resources.

Arctic Food Network © Lateral Office
Mapping is a Powerful Tool
The software has a set of calculation tools that let you run analysis on any elements that you want to use. You can set perimeters to find an area that could be affected by a future event. For instance, you can run calculations to visualize potential flood areas during a rainstorm by using river layer, topography layer and buffer tool. It might sound extremely complicated. To put it simply, you can determine layers to extract information that you need.
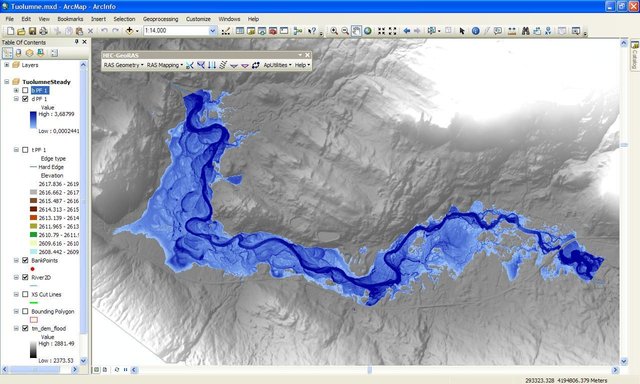
Flood Area Mapping © GIS for Water and Environmental Management
The areas that you gained from these kinds of exercises let you see a new sort of map. From here, one can get creative to bring out their artist self to play cartography.
By extracting information that I need to use to understand a city, one can draw to suggest a new kind of resource network from there, you start to suggest an opportunities of creative economy or new market
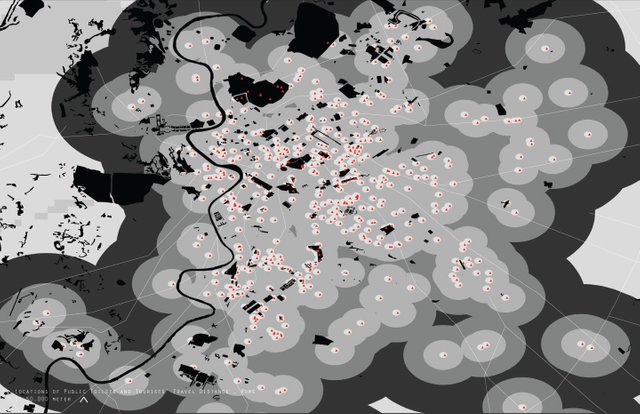
Public restroom locations in Roma, Italy © mintvilla, 2015The different grey color circles represent 5 km, 10km, 15km. From there, one can investigate the tourists’ extent of traveling trajectories in Roma.
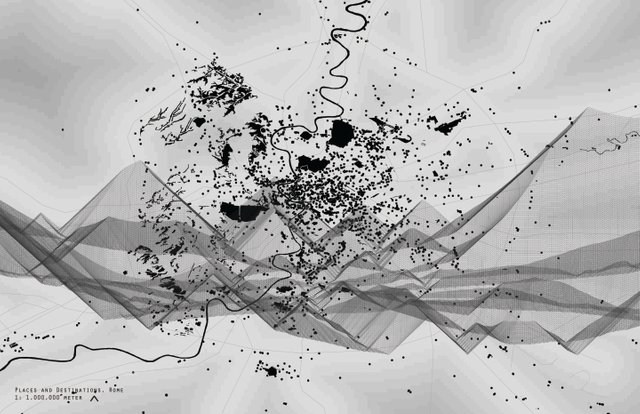
Tourists' Trajectories, Roma © mintvilla, 2015
Maps can represent information you want to present
The map that one draws from mapping can be honestly anything, based your interests, personal experiences or facts that you've acquired. Your favorite restaurants' locations marked on Yelp, where you caught the Pokemons' and all!
You can begin to see how maps are not just geographic outlines and indicators but can host a range of dynamic information and be used to source future projections from historical ones as well as vice versa. The ecosystem is a creative one and ever-growing.
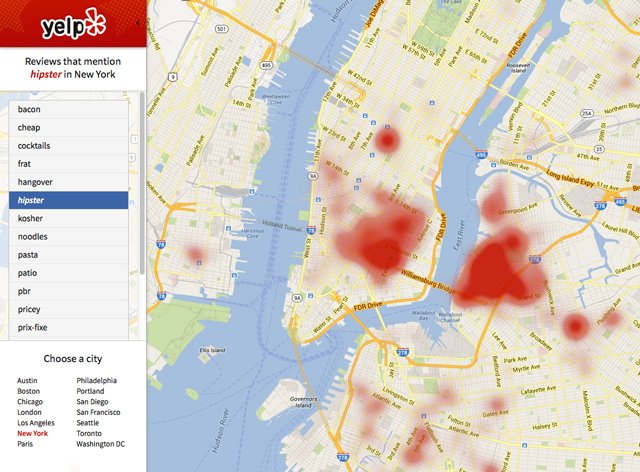
where a word "Hipter" was mentioned on Yelp © Yelp Wordmap via Yelp Official Blog
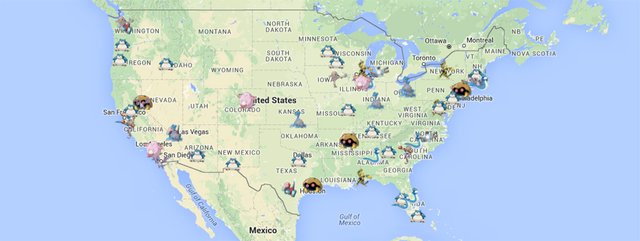
Best cities to catch rare pokemon © Wanderu
Now, could this all be relevant to Steemit and its ecosystem?!
In my next post, I'll produce a case study of how mapping methodologies could transform the landscape of Steemit.

great post @mintvilla. I love maps as artistic images too ;)

thank you @paolobeneforti!
하잉요^^*
바쁘셨나바요?
한참동안 포스팅을 안 하시길래
아프신가 했습니다^^*
암튼 반갑습니다 ㅎㅎㅎㅎ
We seem to be in another cartographic golden age, don't you think?
Thanks @mintvilla, I like looking at maps for when I have to create some out of the world ideas. Seeing so many location on a piece of paper has some effects on me I guess.
Ancient cartographic map describes almost exact map details ^^

오랜만에 포스팅을 올리셨군요.
그런데 과거의 지도들을 보니까, 참 매력적인 하나의 예술이네요.
저 맨처음 지도 벽지로 만들면 참 멋있을것같아요 !! 잘지내시죠 민트님 ? ^^
This post has been deemed resteem & upvote worthy by your friendly @eastcoaststeem ran by Steemian @chelsea88