$DCR/BTC Technical Analysis Dec. 24, 2016.
Hello Steemers!

Doing a chart for Decred today!
Pretty new coin, ranked 64th on coinmarketcap, it was initially distributed by a airdrop.
It is a hybrid proof-of-work proof-of-stake
Fore more info about Decred check out their website and their Bitcointalk thread:
Website - https://www.decred.org/
BCT thread forum - https://bitcointalk.org/index.php?topic=1290358.0
Clean charts for the start. Will show the weekly and the daily here.
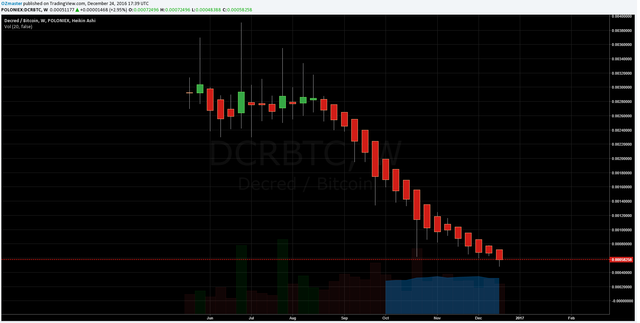
weekly chart Poloniex -clean - Dec. 24, 2016
On the weekly we can see that DCR was traded mostly between 250k satoshi and 300k satoshi at the start of its trading on Poloniex, then it started declining sharply, marking new all time lows as weeks progressed with the lowest point made today at around 48.5k satoshi.
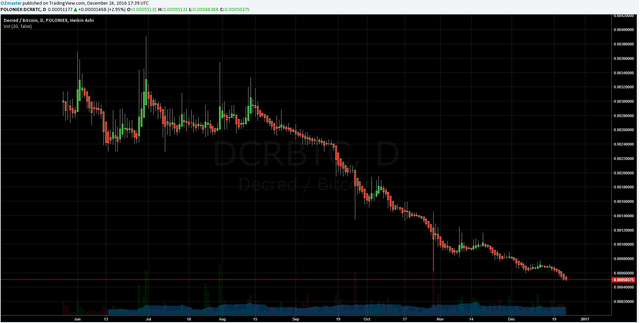
daily chart Poloniex -clean - Dec. 24, 2016
On the daily we can see the waves of trading more clear, with pumps reaching to about 350k satoshi at the start, and we can notice the hard dumps the price has made on its way to the all time low.
Lines up next, added them first on the weekly chart (white lines), then another round on the daily (purple ones).
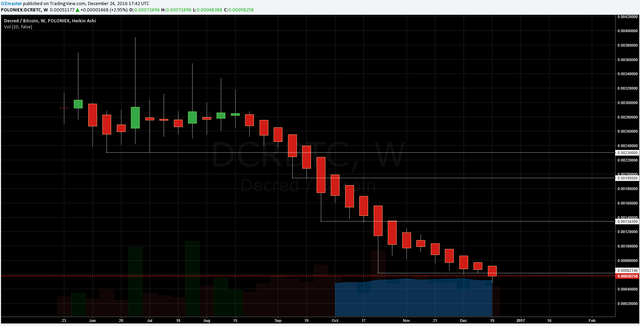
weekly chart Poloniex -lines - Dec. 24, 2016
After brining some lines up to the weekly chart it doesn't tell us all to much so better to go for the daily.
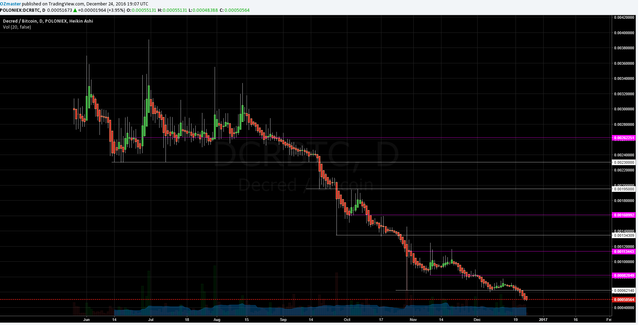
daily chart Poloniex -lines - Dec. 24, 2016
After zooming in into the daily and adding a few more lines we can see possible future accumulation zones, for after the price starts turning.
Pulled the fib on the daily to get a better perspective.
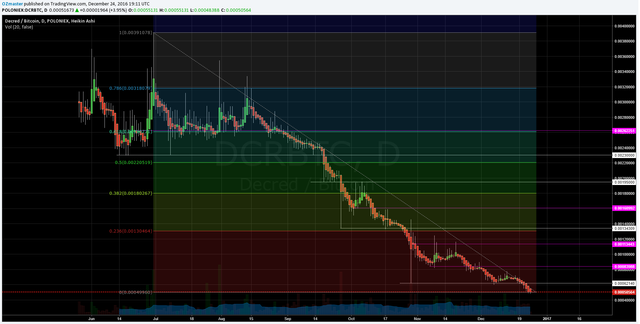
daily chart Poloniex -fib - Dec. 24, 2016
With the fib on the daily we can see the major accumulation zone reaching up to about 130k satoshi.
Bellow it the 2 purple lines seem to be marking a bit lower level accumulation zones, the lower topping at about 85k and the upper one at about 115k satoshi.
The dump to 62k satoshi at the end of October might be marking another resistance level of an even lower accumulation zone.
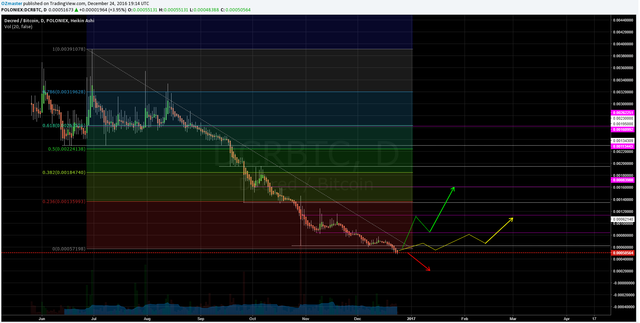
What to expect next?
1st (green) - The price enters a uptrend, progressing through the first accumulation zone rapidly, breaking it and enters the next accumulation zone.
2nd (yellow) - The price found it's bottom and starts trading within the lower level of the major accumulation zone bellow the ~85k satoshi line and then slowly enters the next one which tops at the ~115k satoshi line.
3rd (red) - The price seeks further all time lows.
COMMENT
Once again, I will post the comment by commenting as it involves my personal opinion!
Thank you for understanding!
If anyone has any questions or need's help fell free to ask, I will try to explain as fast and as best as I can.
Critics, comments, reply's, counters, advice's, etc. are always welcome!
Have my charts helped you in any way?Let me know with a comment below :)
Are there more people who are doing TA?
Please post the links to your TA's posts into the comments as well!
DISCLAIMER
I am showing multiple scenarios on the price movement, in the post itself I do not take any stance, either bullish or bearish. I am not responsible for neither you’re winning nor you're losses upon trading! the "comment" section is my personal opinion and does not mean I have to or do hold any positions in the given market.
Everyone who uses TA develops his own unique charting style, please keep that in mind.
Kind Regards, OZ :)
Resteemed
COMMENT
Thinking the price will probably bottom around here then start slowly going upwards using the lines (62k, 85k and 115k) as new resistance / support levels.
https://twitter.com/Sintal1ty/status/813543576579796993
BTC rally nearly ending - DCR Releasing Version 0.7.0 will rally after btc to previous accumulation zones.
Disclaimer: I am just a bot trying to be helpful.