DAX update 17.04.18
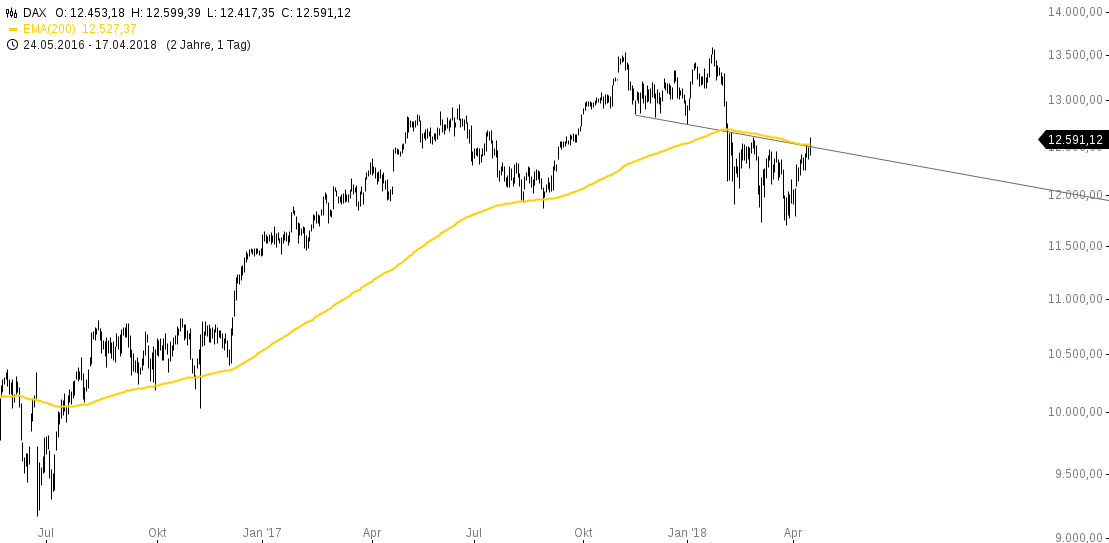
The DAX is above its 200 dma (daily moving average) again! This could mean that the DAX is on its way to 14000.
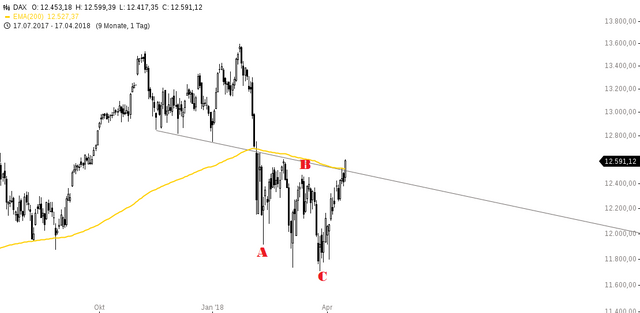
We have a bullish retest of the MA 200 on the 4 hours chart and it looks like the inverted head and shoulders pattern could be triggered soon. When triggered, you will suddenly see explosive bull moves because of FOMO.
.png)
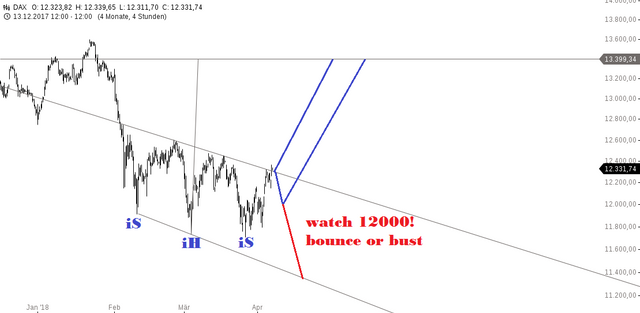
But we cannot be sure yet, if this breakout is sustainable. What we don't wanna see now is a sudden drop of a few hundred points.
.png)
If you think this to be useful information:

Feel free to use and share my charts, but please mention me, @ew-and-patterns as the author. Otherwise it is considered plagiarism and I will flag you and advise my friends to do the same.
.png)
MUST READ!
DISCLAIMER: This post / analysis serves general information purposes only. I am not, and never will be a financial adviser. The material in this post does not constitute any trading advice whatsoever. This is just the way I see the charts and what my trading ideas (from my personal experiences) are. I use chart pattern and Elliott Wave analysis for my trading ideas.
For full disclosure: The author of this post is holding positions in this market at the time of this post. Please conduct your own due diligence, if you plan to copy anyones investment decisions!
If you make any trades or investments after reading this post, it is completely in your own responsibility. I am not responsible for any of your losses. By reading this post you acknowledge and accept to never hold me accountable for any of your losses.
Please consider leaving a comment, like or resteem, if this post entertained you or helped you see things differently...
Have a nice day :-)
Muy bueno el análisis que haces! Si le aplicas las bandas de bollinger junto al análisis MACD puedes ver que las lineas se interceptan para formar una tendencia alcista!
Esta Criptomoneda promete... gracias por compartir el post!!
it seems like bull trap
Great, great analysis. Yes, the level at $12500 can hold, price could move up to $13000.
This was my original forecast, but it my be risk off environment at this time...more importantly the power of the monthly demand zone.
You got a 20.54% upvote from @brandonfrye courtesy of @ew-and-patterns!
Want to promote your posts too? Send a minimum of .10 SBD or Steem to @brandonfrye with link in the memo for an upvote on your post. You can also delegate to our service for daily passive earnings which helps to support the @minnowfund initiative. Learn more here