Exploring the many variations and combinations of Proportional Area Chart
Recently, I have written a couple of posts exploring the many types of variations and combinations that you can get from a Proportional Area Chart.
The first is titled Further Exploration #10: Proportional Area Chart Variations and features 7 alternatives ways you can display this chart type for various situations.
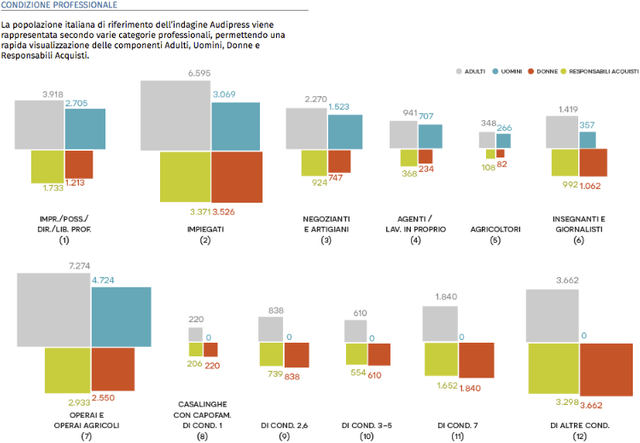
Image Source: Analisi della popolazione italiana, Visual Report di Audipress
In the next post titled Chart Combinations: Proportional Area Charts, I featured 34 examples of charts combined with a Proportional Area Chart.
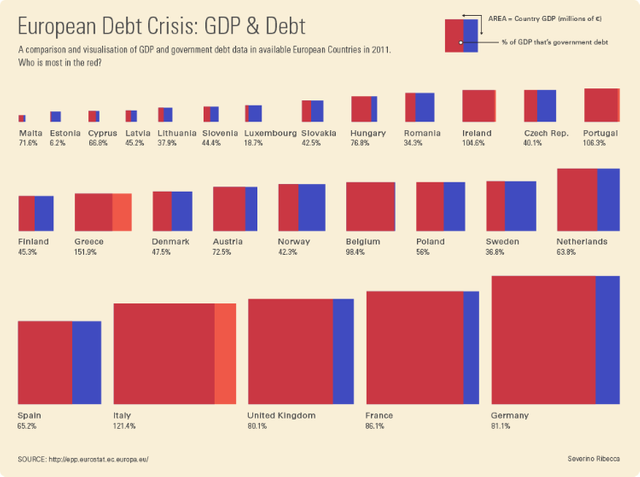
Image source: European Debt Crisis: GDP & Debt, Severino Ribecca