S&P500 Moving Average Pattern Recognition (Best Stocks)
Happy Easter weekend Steemers,
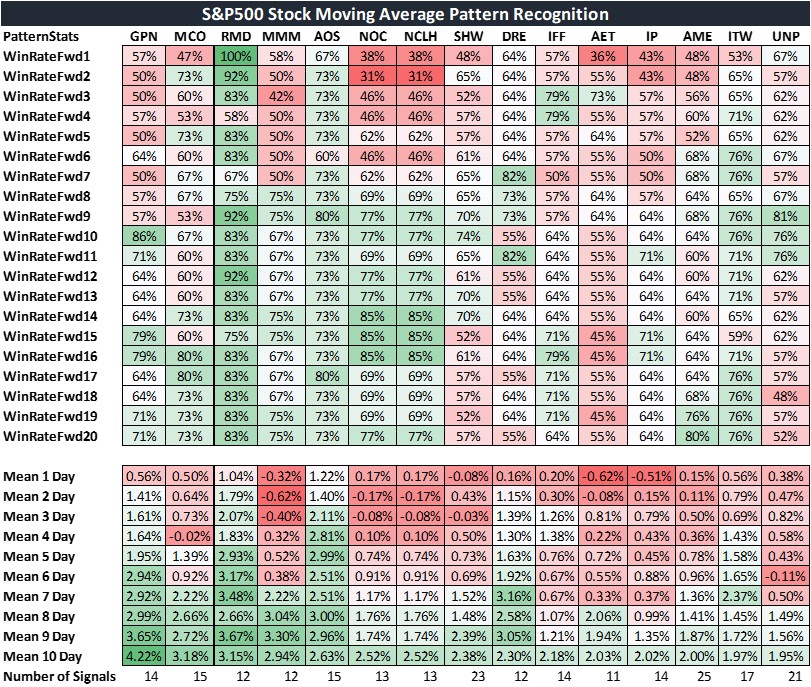
Today's post revolves around statistical pattern recognition for stocks in the S&P500 index.
What is statistical pattern recognition? Statistical pattern recognition uses simple math to define if a current price pattern is on average similar to historical price patterns. The method outlined in this post used a price to moving average ratio. My methodology for the following pattern recognition is to take price as a ratio to the following simple moving averages: 200,150,100,50,25.
All of the above moving averages are arbitrary apart from the fact that if shorter term moving averages are used more samples would be matched and... in my opinion create a significant amount of noise.
On average, price has to match 99% to the distance from the 200,150,100,50 and 25 moving averages. If the computer finds such a match, forward returns are then calculated. I do this for every stock in the S&P500 index and have subsequently filtered on highest mean 10 day returns.
Note.: This study suffers from pure data mining bias and does not consider statistical validity in the slightest. Of the 15 companies shown below, 25 samples was the largest dataset of matching patterns.
With that being said, here are your historical returns from the moving average pattern match:
Of note, Global Payments has the highest 10 day return mean with the highest 10 day win rate (price higher than price on signal day)
That's all for now,
Publiclunch