Stellar (XLM) Technical Analysis: READY TO MOVE?

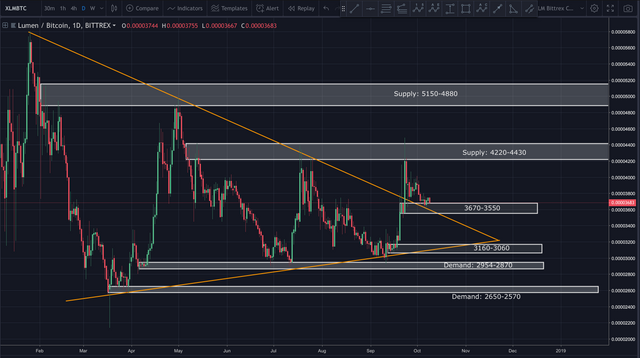
Stellar is starting to look rather interesting. Zooming out on the daily chart, we see price recently broke out of the larger wedge it’s been in for all of 2018. What’s significant is not just breaking out of the wedge, but also the fact it created a higher high for the first time this year. Stellar has since retraced to a small demand zone between 3670 and 3550 satoshi.
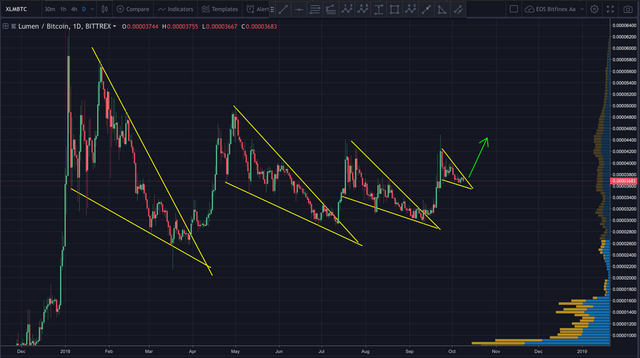
If we look at the pattern for 2018, we can see price has continuously retraced within a falling wedge...each one smaller than the next. It seems to be reaching the apex of another smaller falling wedge. If history is any guide, we may see a breakout soon. Of course, like all altcoins, Stellar is heavily influenced by Bitcoin. If Bitcoin falls, Stellar will fall right along with it.
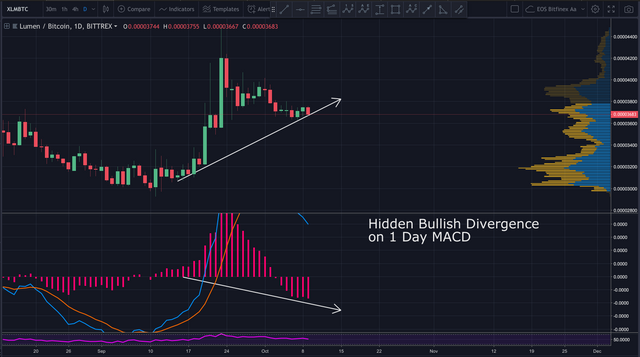
The daily MACD reveals hidden bullish divergence.
In today’s video analysis, I discuss possible targets for Stellar, where price may go in various scenarios, where to consider setting your buy/stop-loss and MUCH more. I hope you find it helpful.
Video Analysis:
If you’re viewing this on a site other than Steemit, and you don’t see the above video, navigate to Steemit or TIMM (https://mentormarket.io/profile/@workin2005) in order to watch.
I hope this has been helpful. I’d be happy to answer any questions in the comment section below. Until next time, wishing you safe and profitable trading!
Workin
If you found this post informative, please:

Open an Account on Binance here:
https://www.binance.com/?ref=16878853
Support the Crypto Ecosystem with Brave Browser:
https://brave.com/wor485
Twitter handle is @Workin2005 and Facebook is https://www.facebook.com/Workin2005
Published on:

by Workin2005
