EOS Technical Analysis: THE CONSOLIDATION MAY SOON BE ENDING

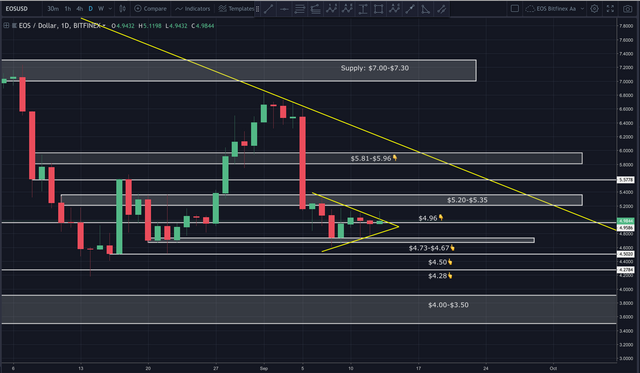
EOS is reaching the apex of a larger wedge. This suggests an end to consolidation and the beginning of a larger move...up OR down.

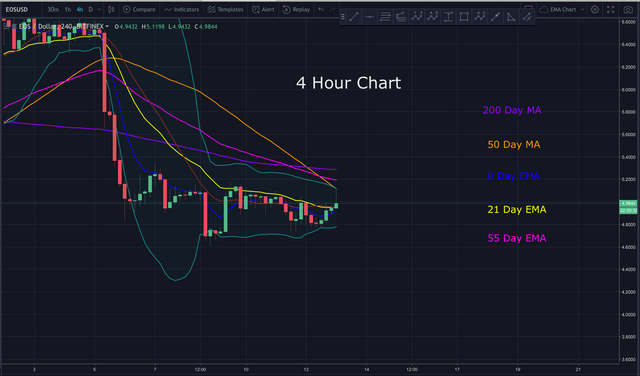
Looking at the 4 hour chart, we can see price has broken above the 21 day EMA, which is a bullish sign of strength. The 8, 21 and 55 day EMA are starting to converge, as is the 50 and 200 day MA. The Bollinger Bands are also starting to narrow (bottleneck). This often precedes a larger move in price.

In today's video analysis, I discuss where price may go from here, traps to avoid, market psychology and MUCH more information not found above. I hope you find it helpful.
Video Analysis:
If you’re viewing this on a site other than Steemit, and you don’t see the above video, navigate to Steemit or TIMM (https://mentormarket.io/profile/@workin2005?aff_id=Workin2005) in order to watch.
BIAS:
Short Term: Neutral
Longterm: Bullish
I hope this has been helpful. I’d be happy to answer any questions in the comment section below. Until next time, wishing you safe and profitable trading!
Workin
If you found this post informative, please:

Open an Account on Binance here:
https://www.binance.com/?ref=16878853
Support the Crypto Ecosystem with Brave Browser:
https://brave.com/wor485
Twitter handle is @Workin2005 and Facebook is https://www.facebook.com/Workin2005
Published on:

by Workin2005
