EOS Technical Analysis: BOTTOMING OUT OR LOOK OUT BELOW?

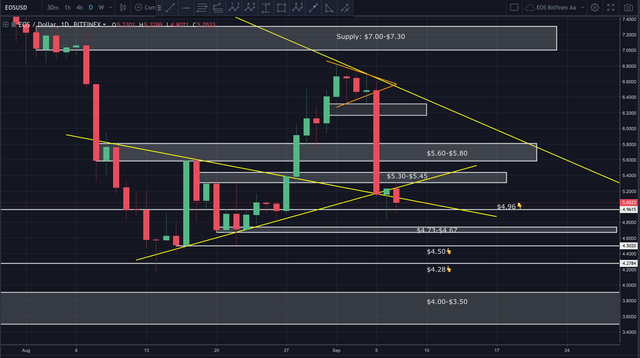
EOS continues to show weakness. Price has collapsed below both trend lines. While we might see a slight bounce in the short term, I don’t believe we’ve seen the bottom.
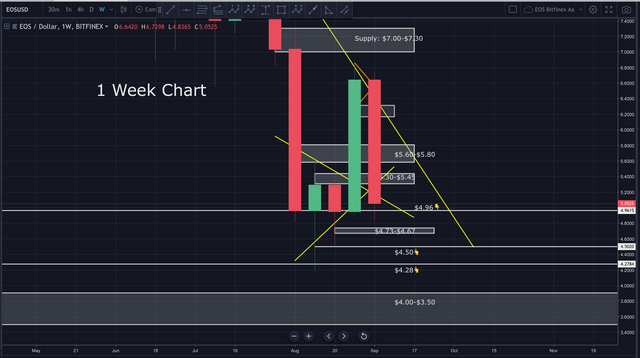
Zooming out on the weekly chart below, we see the body of the 4 prior 1 week candles all found support at $4.96. They wicked through, but the body remained at or above $4.96. We still have 2 days before this weeks candle closes. If the body closes below $4.96, it could be a sign of much lower prices to follow.
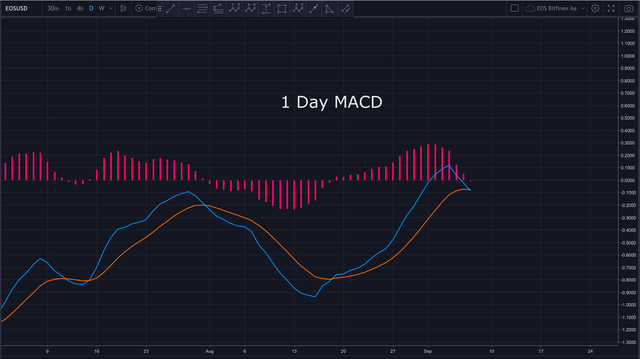
The daily MACD just crossed into bearish territory.
In today’s video analysis, I discuss where the bottom might be, what to expect in the short term, possible Elliot counts and MUCH more information not found above. I hope you find it helpful.
Video Analysis:
If you’re viewing this on a site other than Steemit, and you don’t see the above video, navigate to Steemit or TIMM (https://mentormarket.io/profile/@workin2005?aff_id=Workin2005) in order to watch.
BIAS:
Short Term: Slightly Bearish
Longterm: Bullish
I hope this has been helpful. I’d be happy to answer any questions in the comment section below. Until next time, wishing you safe and profitable trading!
Workin
If you found this post informative, please:

Open an Account on Binance here:
https://www.binance.com/?ref=16878853
Support the Crypto Ecosystem with Brave Browser:
https://brave.com/wor485
Twitter handle is @Workin2005 and Facebook is https://www.facebook.com/Workin2005
Published on:

by Workin2005

Hey it will come back..
When I first started I got excited when teem went up over $1.00...
I agree. I'm extremely bullish on EOS long term.