EOS is trying to decide which path to take
EOS is trying to decide which path to take. The market currently has no clear direction. There are good arguments to be made for both a bullish and bearish scenario. Let's start with the bearish.
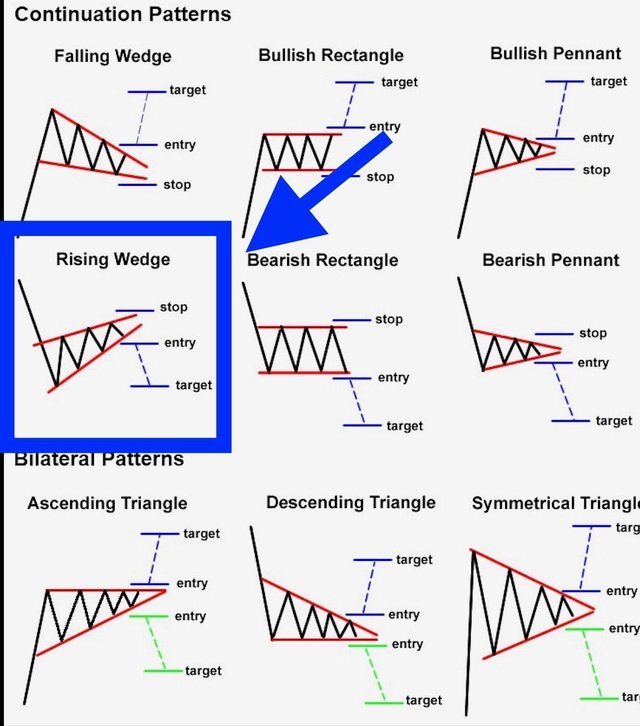
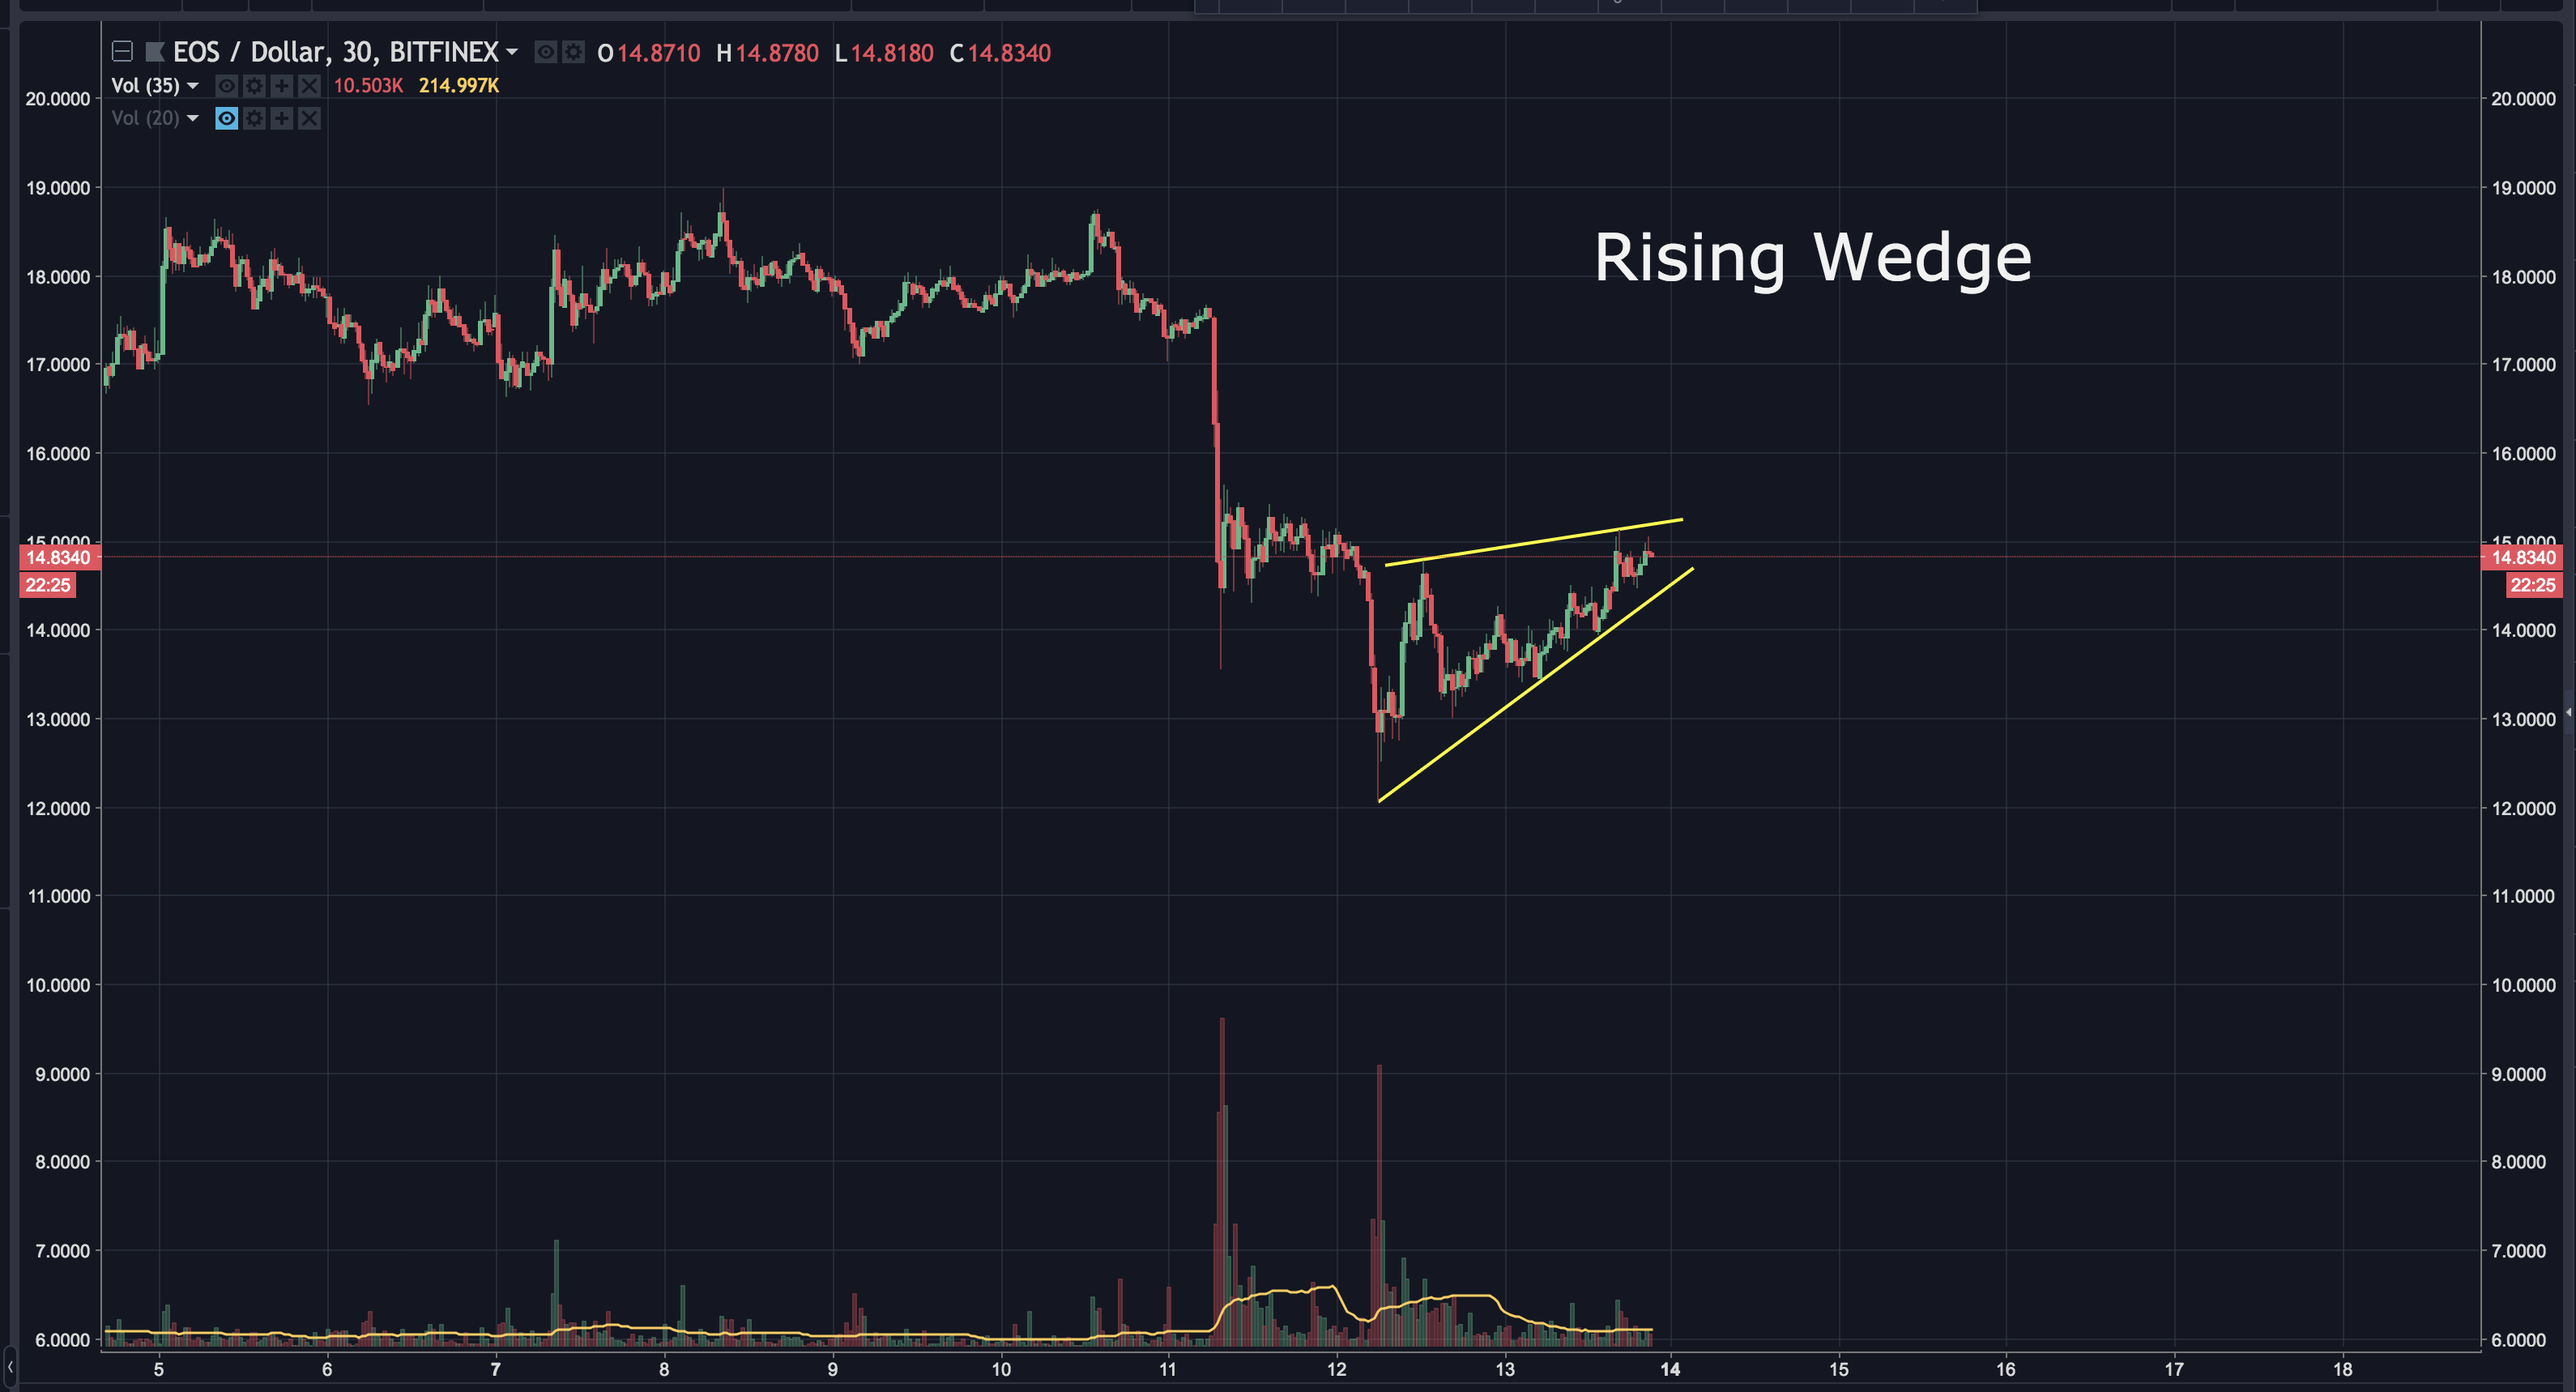
Like Bitcoin, EOS seems to be forming a rising wedge. This could indicate a drop is coming.
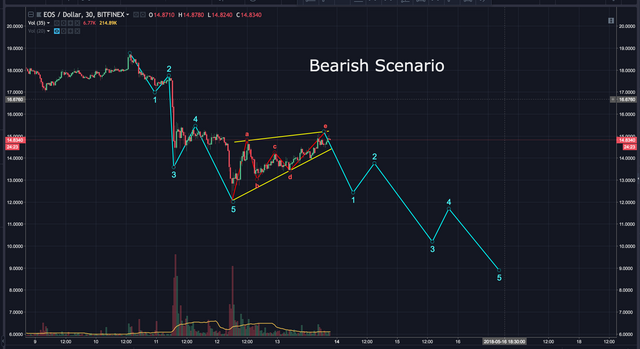
I pointed out a possible 5 waves down a few days ago...which ended up playing out. It looks like an ABCDE correction has taken place. If this count is correct, we can expect another 5 waves down to start relatively soon. It may play out like this:
Now for the bullish argument:
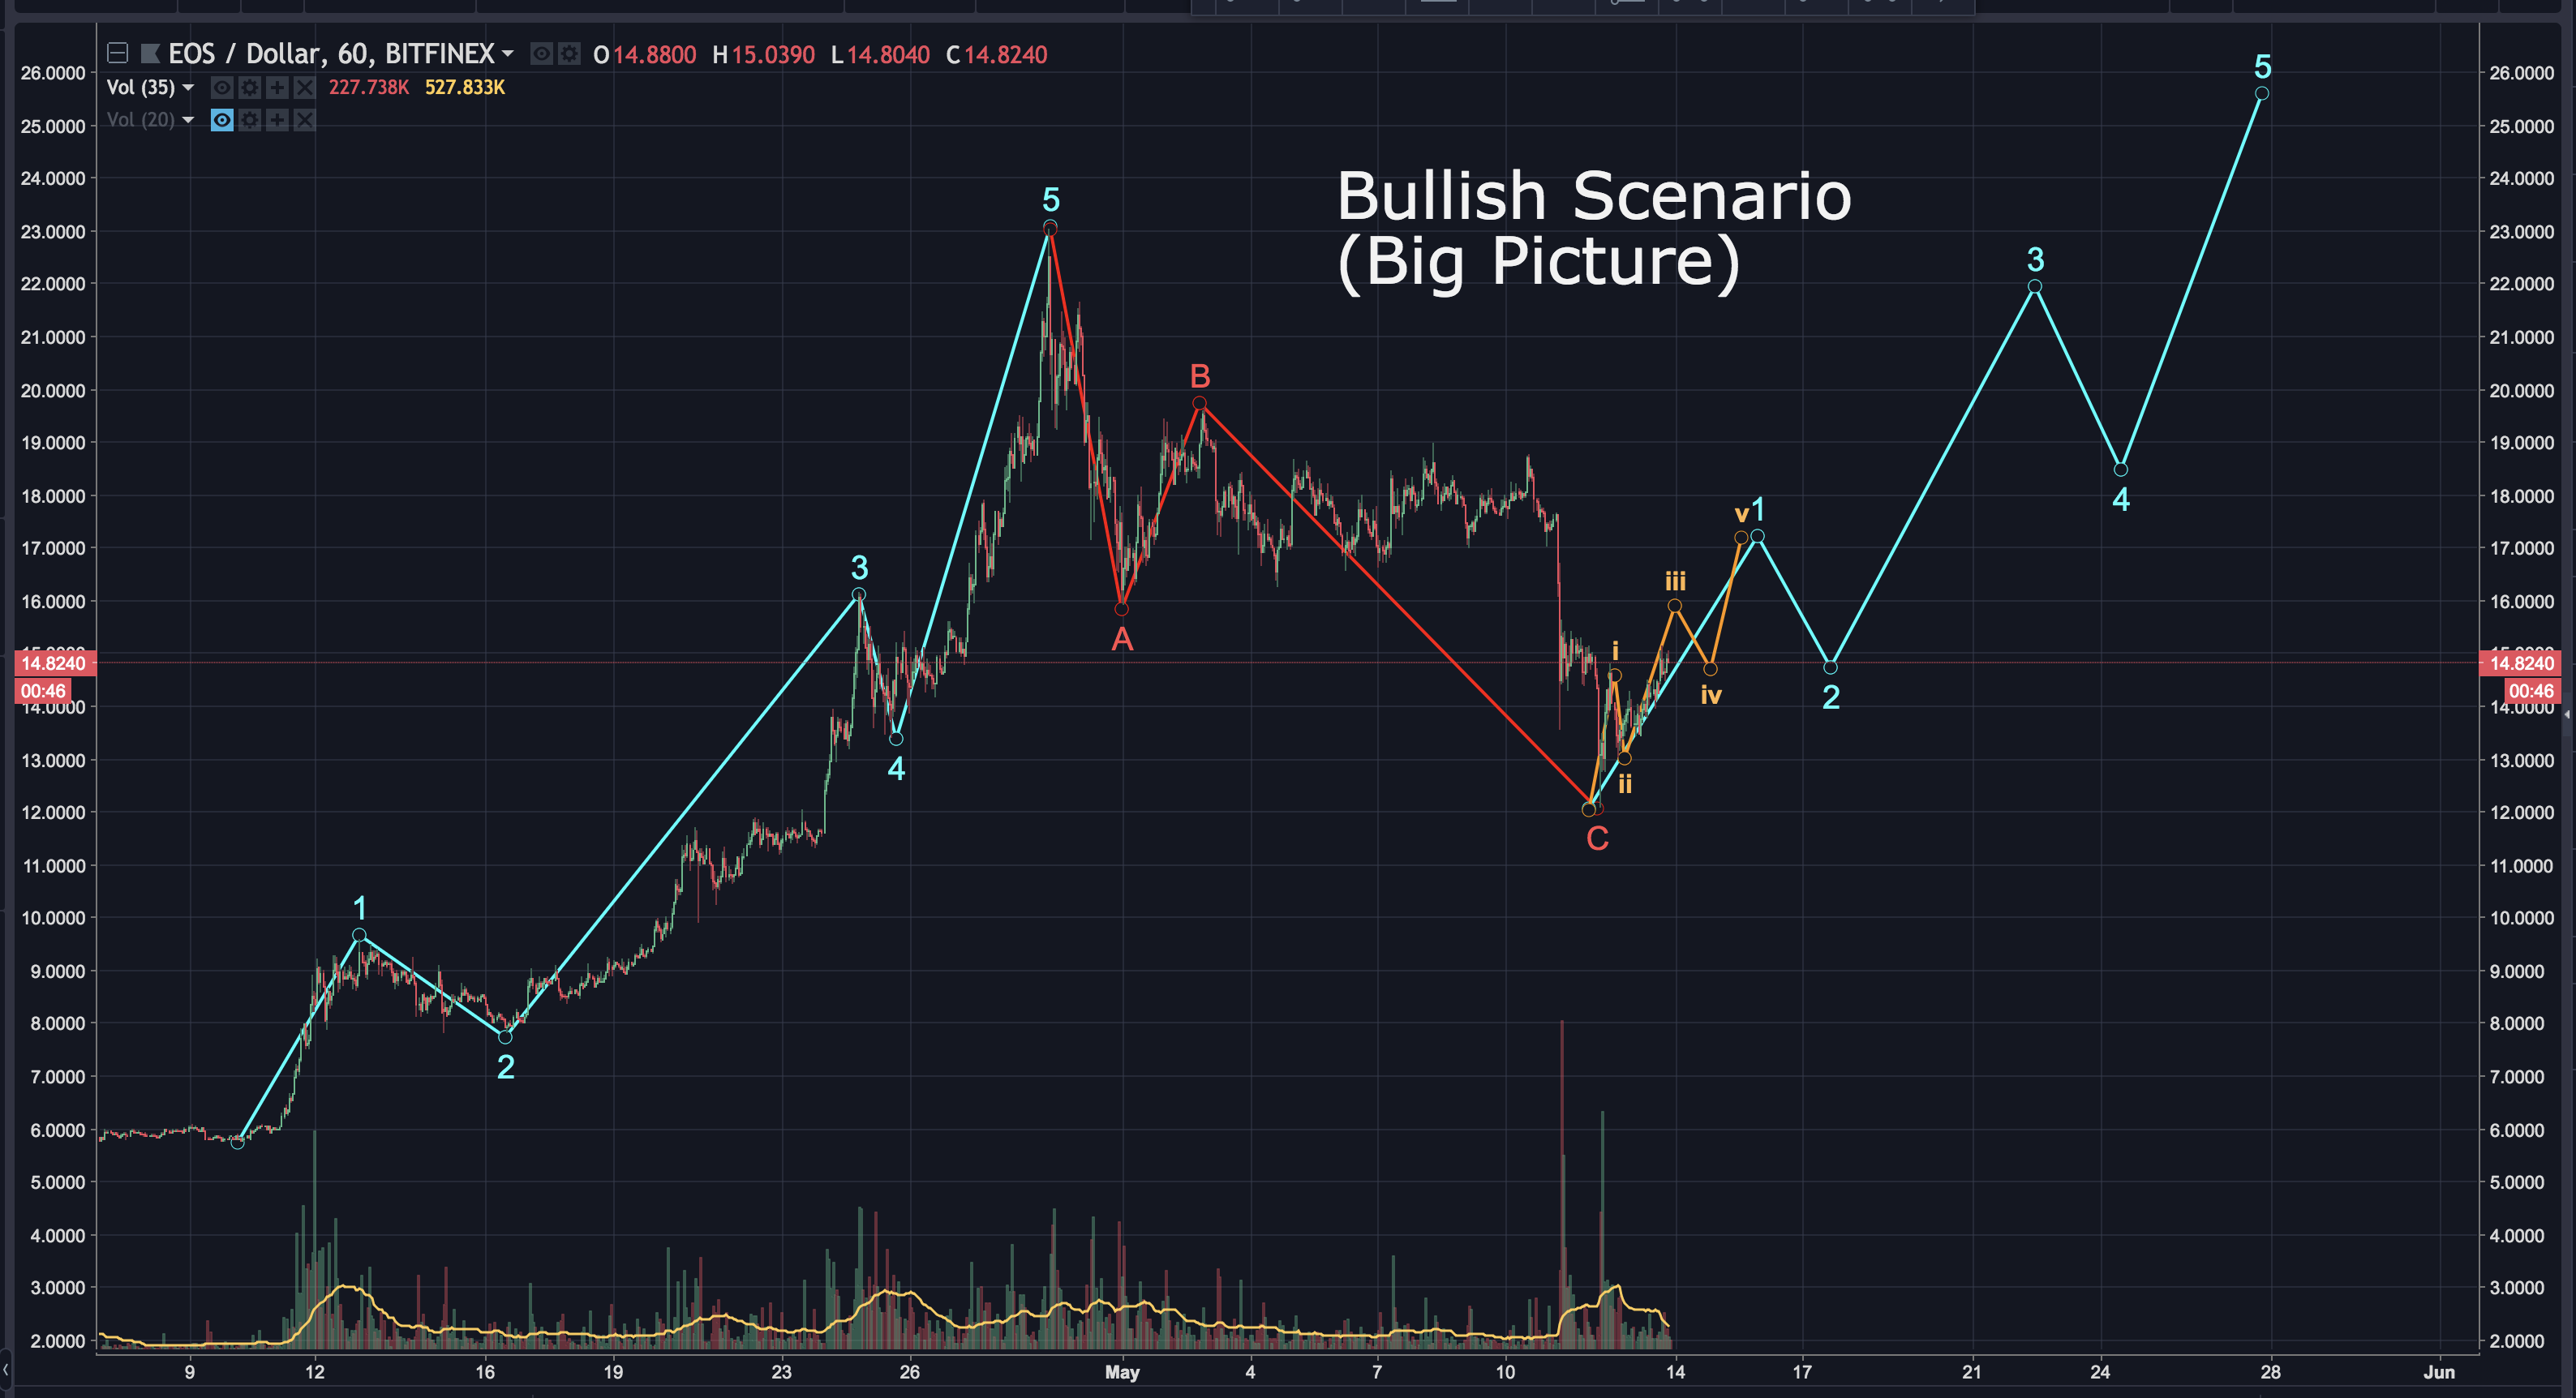
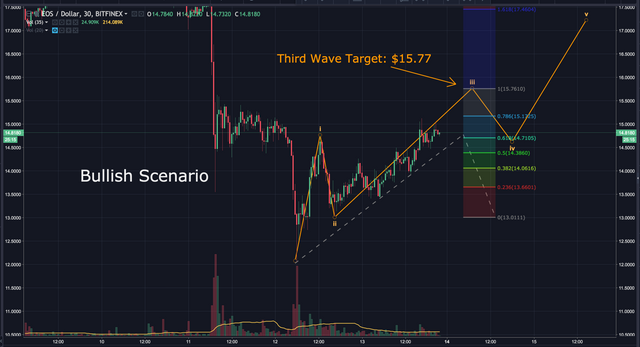
If we zoom out to the 4 hour chart, we can see 5 completed waves, followed by a rather rough, but valid ABC correction. If this count is correct, we are in the first of 5 waves up. I've highlighted the primary waves in blue, with the sub-waves in orange.
Zooming into the 30 min chart, you can get a better look at the sub-waves. You can see we're currently on the 3rd wave, with a target of $15.77.
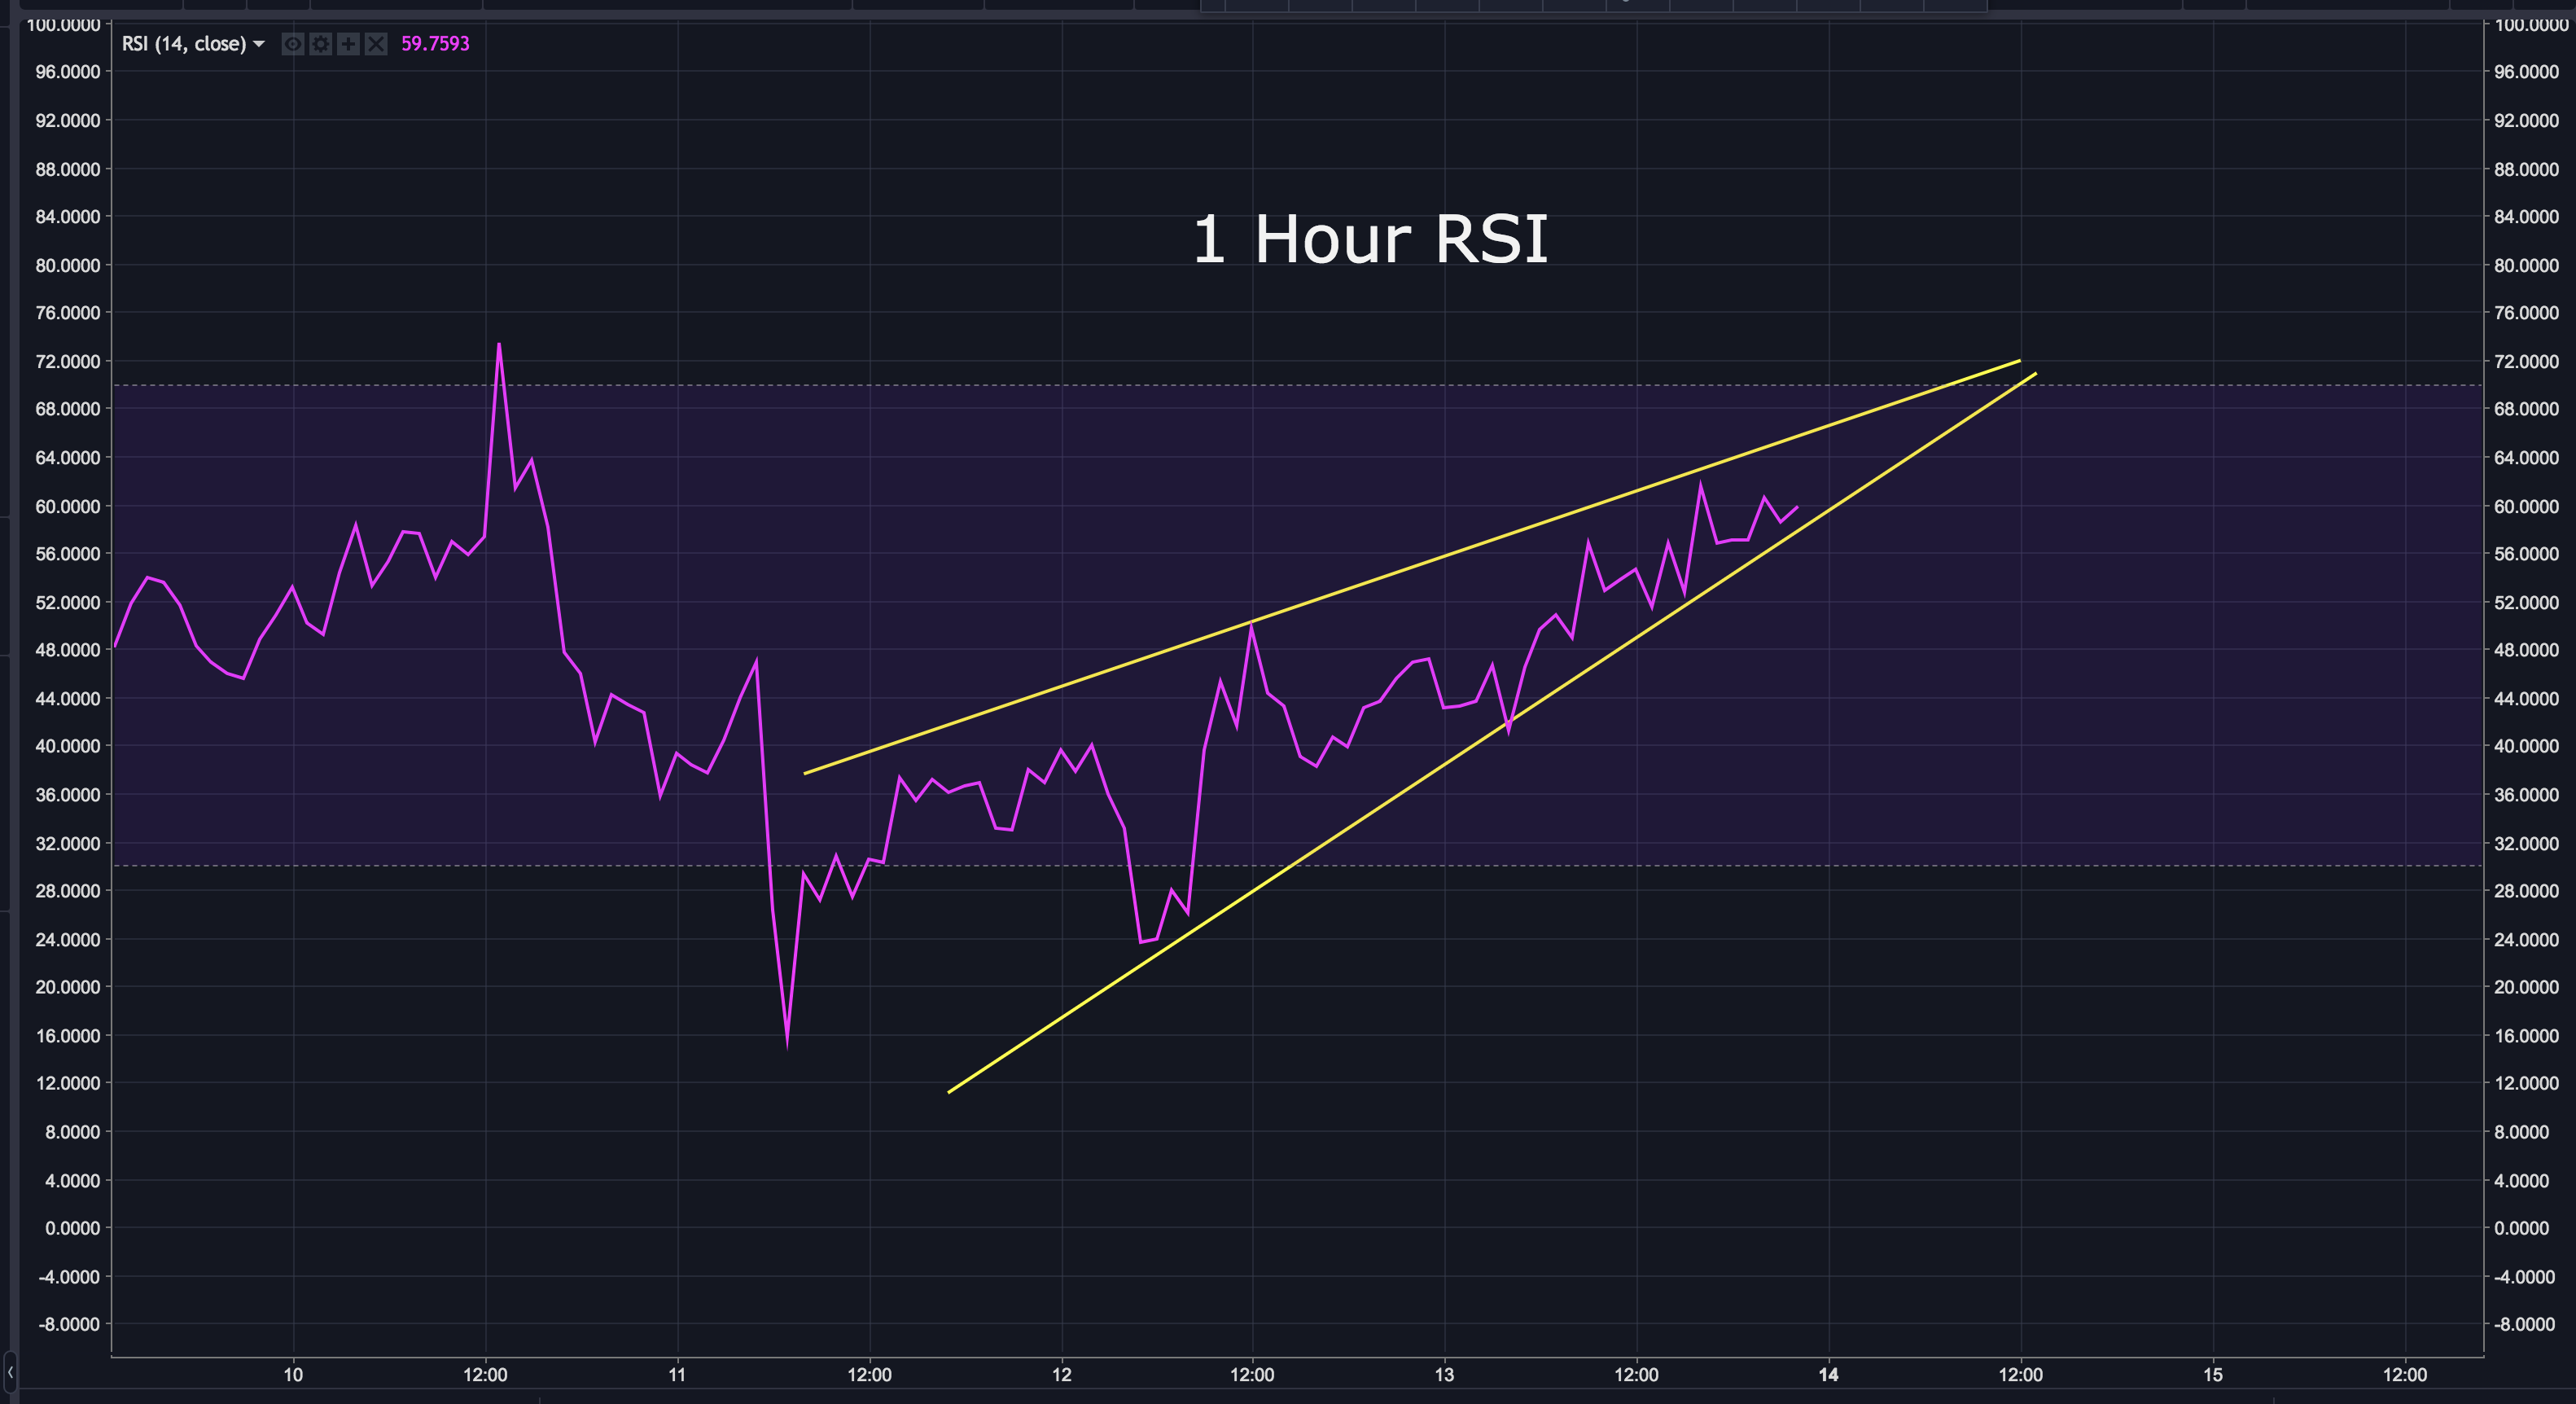
Looking at the 1 hour RSI, we can see it's remaining within a wedge that's tightening. As it reaches the apex, it may break down. This could be signaling the start of wave 1 in the bearish scenario, OR the end of wave 3 in the bullish scenario.
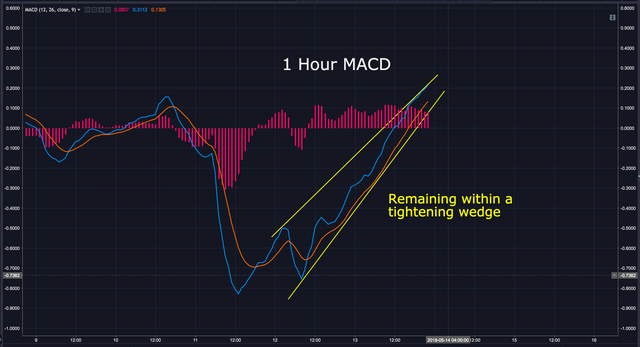
Looking at the 1 hour MACD, we also see it's remaining within a tightening wedge. This could also indicate a break down is to come....however, as explained above, that would fall in line with the bull or bear scenario.
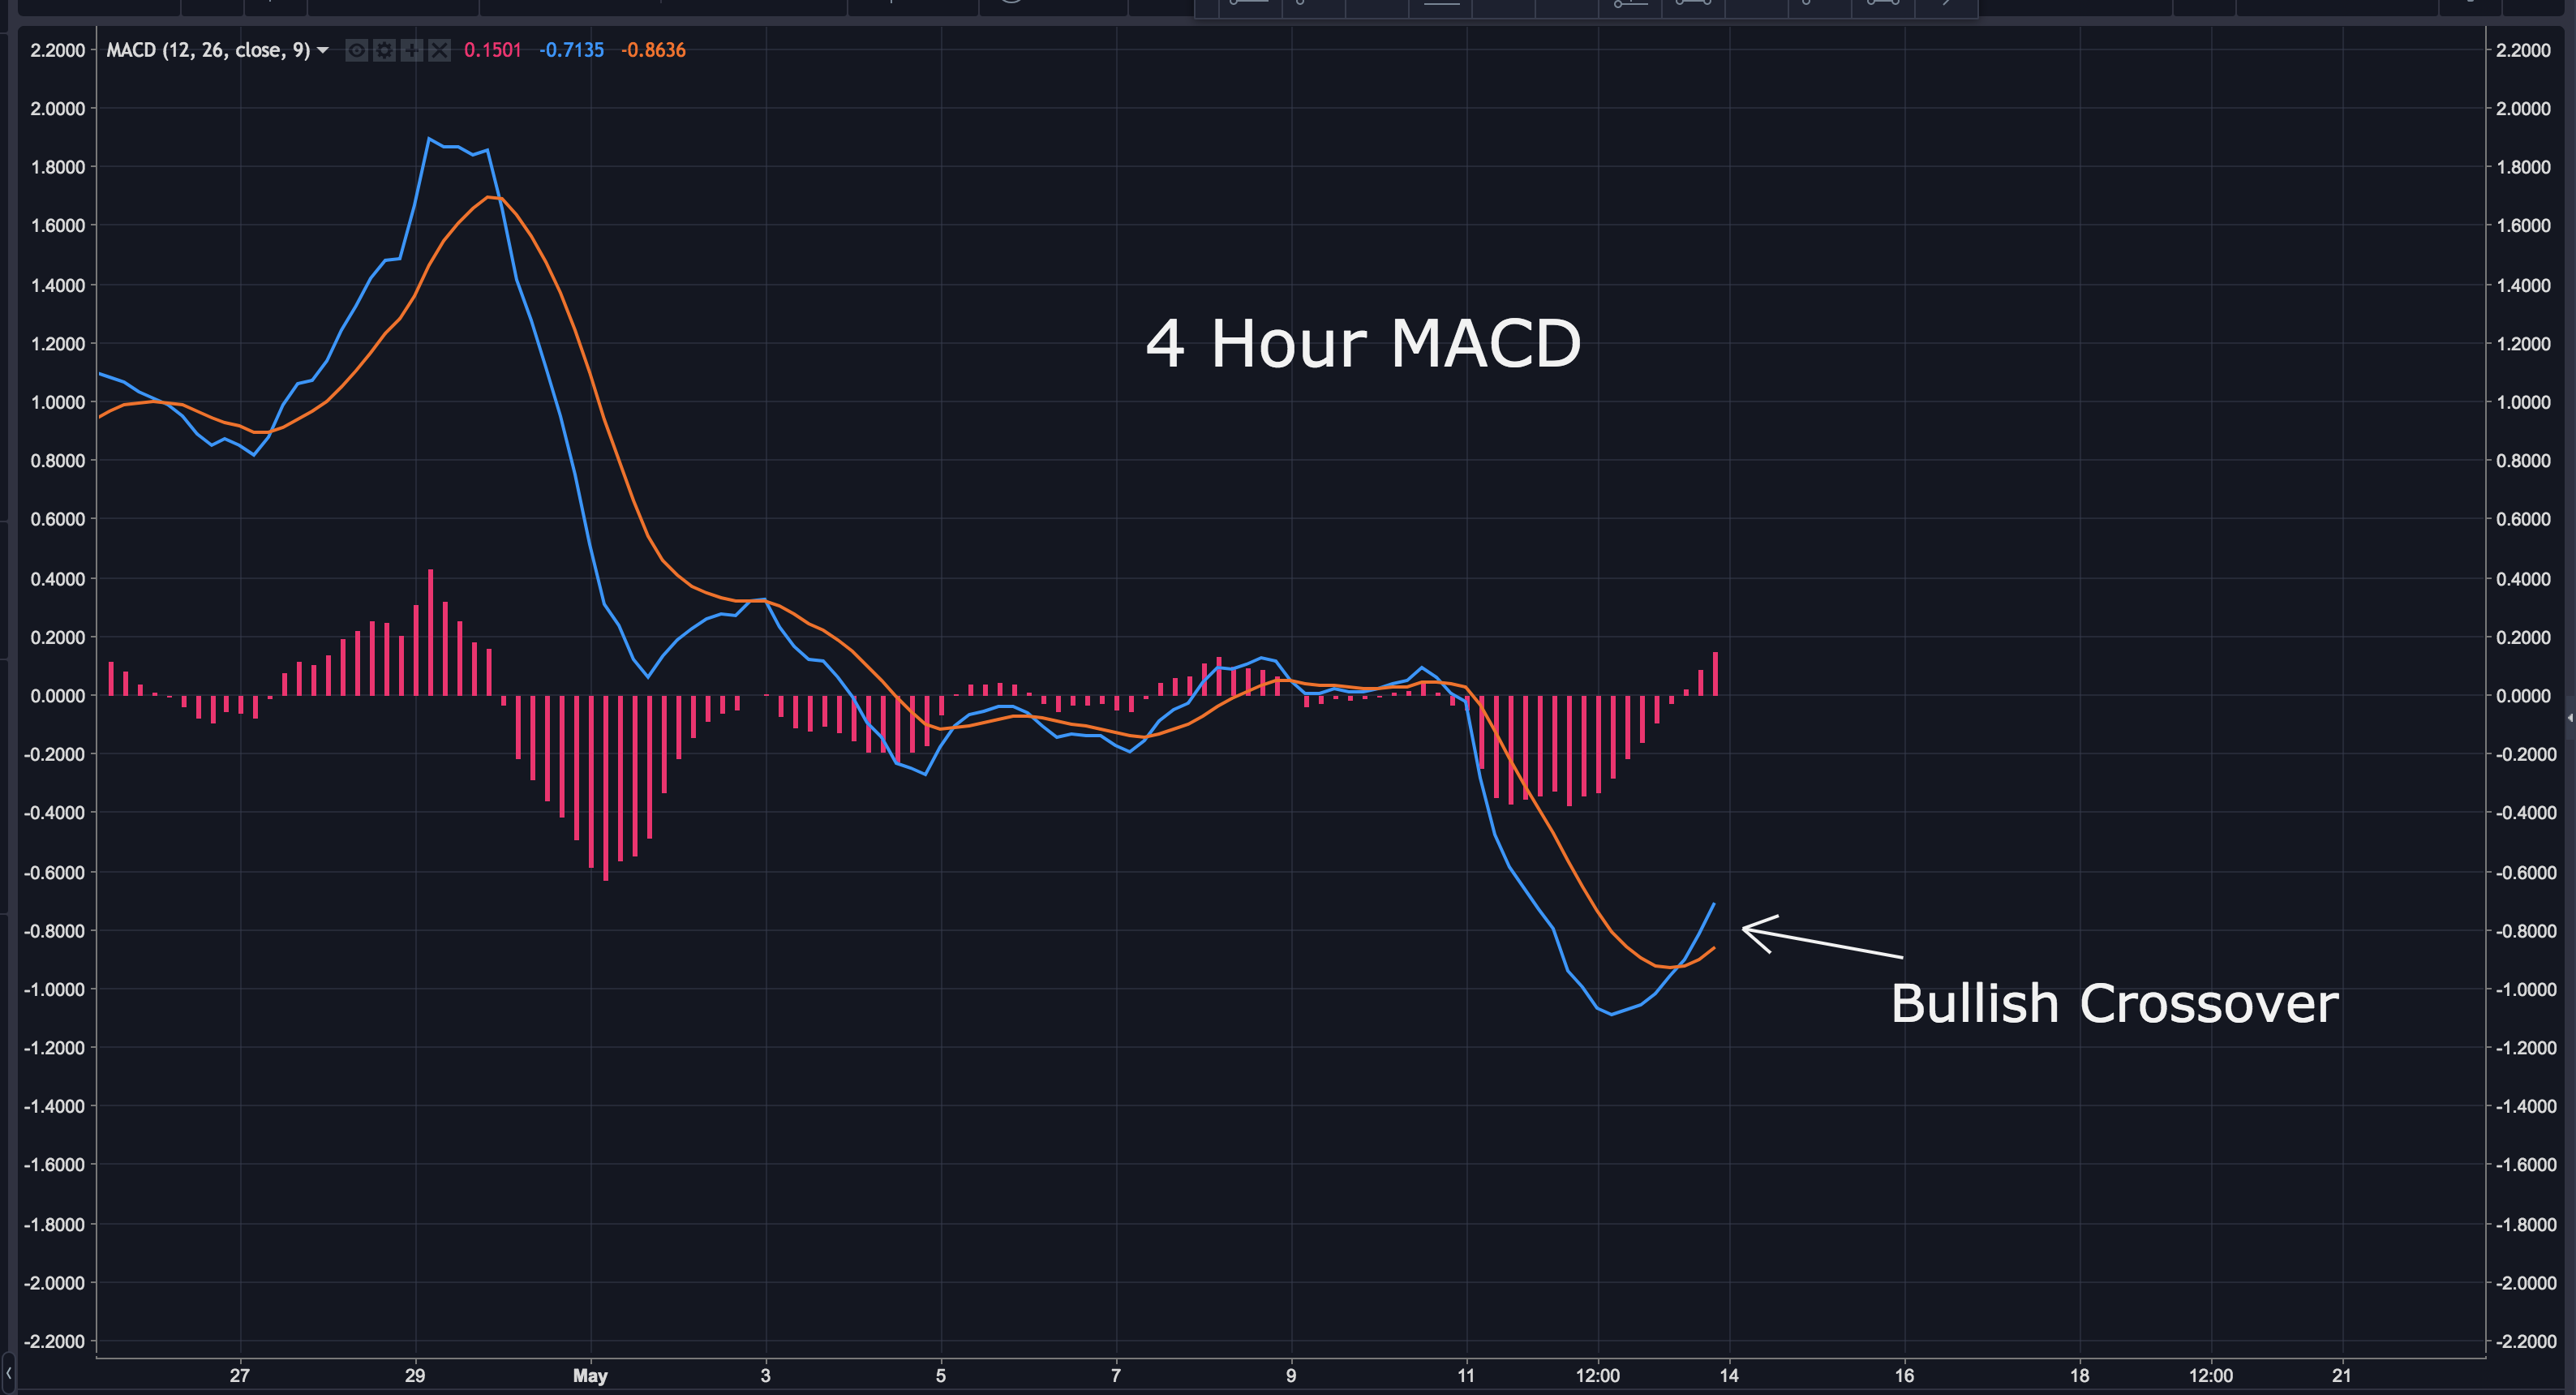
Looking at the 4 hour MACD, we can see it just crossed over. This is looking very bullish on a larger scale. It could indicate the bullish scenario is valid. If/when EOS dips, this would be the indicator I'd be watching. If the 4 hour MACD is barely phased, we are most likely in the bullish scenario.
BIAS:
Short Term: Neutral
Longterm: Very Bullish
I hope this has been helpful. I’d be happy to answer any questions in the comment section below. Thanks for stopping by.
If you found this post informative, please:
Disclaimer: I am NOT a financial advisor and this is NOT financial advice. Please always do your own research and invest responsibly.
If you don’t have an account on Binance, I STRONGLY recommend getting one. They’re usually the first to get reputable coins, have excellent security and second to none customer service. You can sign up here for free: https://www.binance.com/?ref=16878853


Excellent analysis. Thanks for sharing, Would love to see you analyze Stellar (XLM).
This changes rapidly and plays out very quickly. I see either of these scenarios play out by the 16th or 17th. While I'd prefer the bullish scenario, the bullish target once it picks the preferred route is the same, correct? I think I'll spare myself the short term journey and just remain confident in my outsized stake in EOS and just be content with airdrops, and the march toward the mainnet launch, which should bring the bulls back to the table in a big way. Great charting, thank you @workin2005.
Hey there! You were features in the @newbieresteemday's weekly #MinnowMondays post. Feel free to check it out here
I regret not getting EOS when I learned about it months ago. I'm really a newbie in crypto and nontechy too. I wouldn't understand all those charts so thanks for translating them to human language :)
I found this post through @amariespeaks' Minnow Mondays. :)