Bitcoin Update: The Bulls Flex Their Muscles

Bitcoin has been doing well the past couple days. It broke out of the descending channel I pointed out in my last update. There are a few bullish signs suggesting bitcoin may be ready to test $10K again. That said, we're not out of the woods yet.
There are many ways to count bitcoin's movement over the past few weeks. The recent rise in price falls in line with the prior bullish and bearish scenarios I laid out a few days ago. Only time will tell which one is accurate. My being a bull at heart, let's start with the bullish count.
Right off the bat, we can see a bearish looking rising wedge. This may indicate a drop is coming, however, that's not necessarily bearish overall.
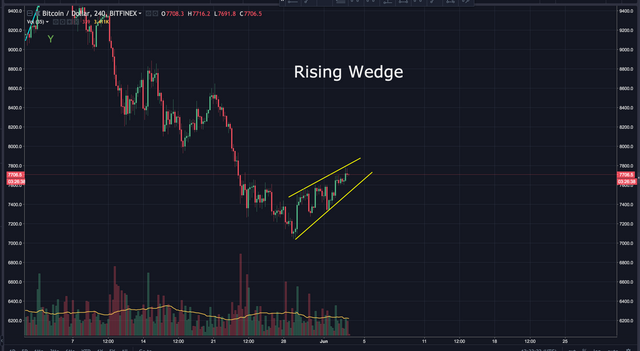
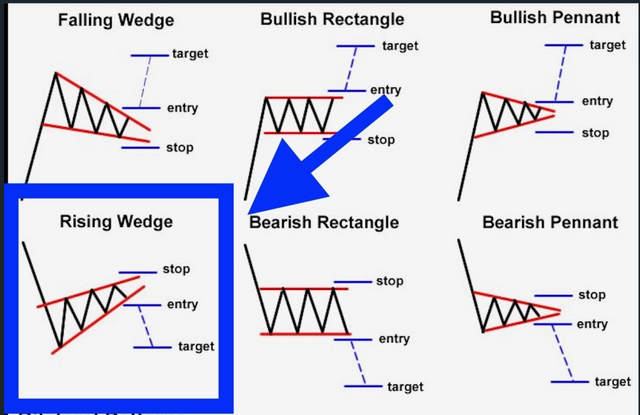
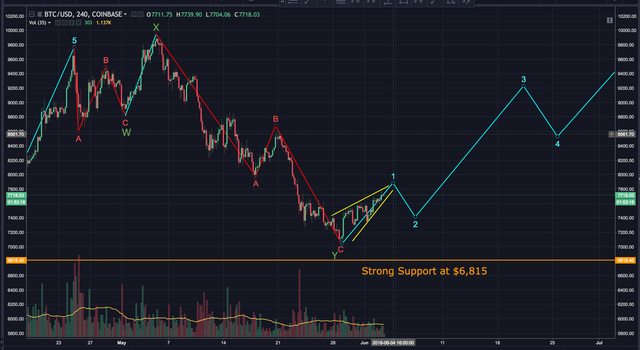
If the following is correct, bitcoin completed a WXY pattern and is currently about to complete wave 1 of 5. That rising wedge may just be foreshadowing the coming wave 2. Here's how it could play out:
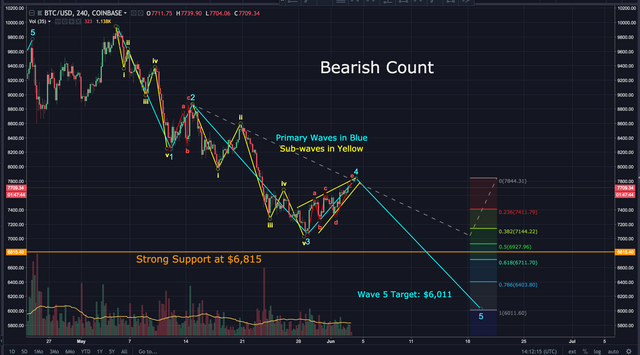
Unfortunately, there's also the very real possibility of a bearish scenario. One could count bitcoin's price movement over the past few weeks as 5 waves down. If this is accurate, bitcoin is currently finishing wave 4, with a target for wave 5 of approximately $6,011.
While both scenarios are very possible, I find myself slightly partial towards the bullish count for a few reasons. I'll just point out a couple.
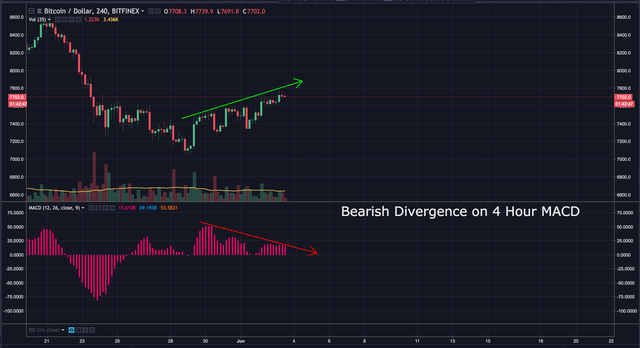
Looking at the 4 hour MACD, we can see bearish divergence. This does indicate a drop may be coming. However, it may just be temporary as it completes wave 2 of the bullish scenario.
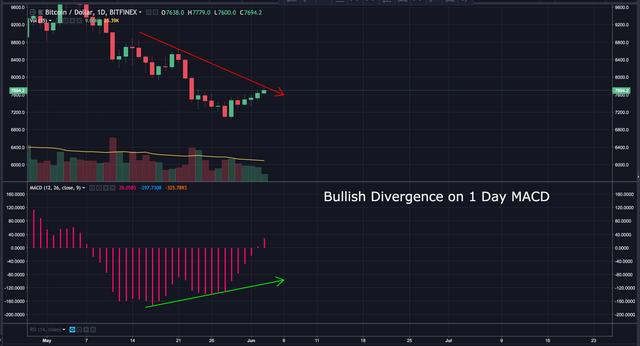
Zooming out to the 1 day MACD, you'll find BULLISH divergence. This could indicate an overall uptrend, while lending credibility to the bullish count.
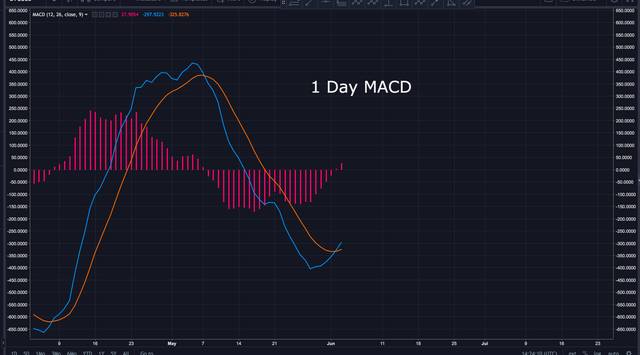
Looking further at the 1 day MACD, we can see it's just crossed over to the bullish side...and there's plenty of room to run. This also helps lend credibility to the bullish count.
Last month I wrote a post on how to use EMA's. If you missed it, the link is here:
https://steemit.com/cryptocurrency/@workin2005/simple-effective-strategy-to-buying-and-selling-market-trends
Long story short...On the 4 hour chart, when the 55 day EMA crosses to the bottom, the 21 day is in the middle and the 8 day EMA moves on top, that's generally a good time to enter a swing trade. Looking at the 4 hour chart, we can see that setup just happened...
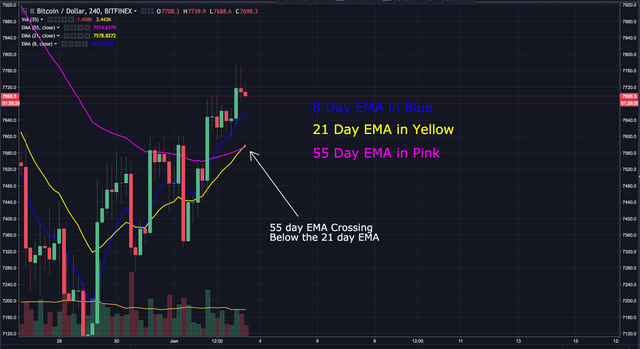
I'd wait for the 8, 21 and 55 day EMA to fan out slightly before entering a position, simply because the market has been riddled with uncertainty over the last few months. Still, this is a bullish sign of strength.
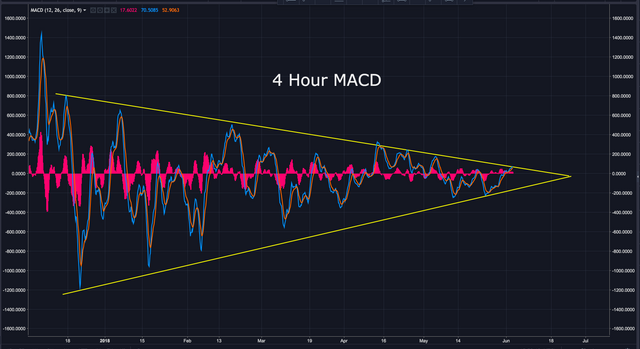
We also continue to watch the wedge on the 4 hour MACD. As it gets near the apex, we may see a major move in one direction or the other in the next few days.
Now let's zoom out and look at the bigger picture.
When you throw a rock in the water, what happens? You get ripples (waves) that form out from the point at which the rock hit the water. They rise and fall....rise and fall. The bigger the wave, the greater the fall. As they get further from the starting point, the ripples get smaller.
Think of the massive bull run at the end of 2017 as a big rock that hit the water. We had a ton of new money buying bitcoin. The further we get from that excitement, the smaller the ripples get.
Bitcoin seems to have been following that pattern since the end of December. We can see a huge bull run, followed by a massive drop, followed by another smaller bull run, then a smaller drop, and so on. We continue getting lower highs with each small bull run. The good news is, each time we've had a drop, we've seen higher lows.
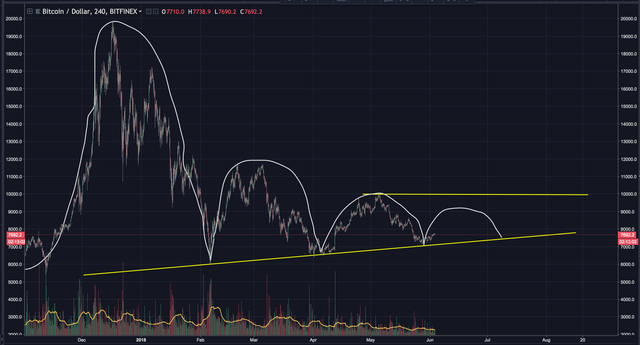
The last small bull run brought us to approximately $9,950. We may (notice I said MAY) now be entering another small bull run. Will it follow the same pattern as before, reaching a lower high before dropping? I can't say, but it's certainly something to keep an eye on.
If we break above $10,000, we'll have broken this pattern. That would be a very bullish sign. Conversely, if we drop below the ascending support line I've outlined, that would be a very bearish indication. Let's see how it plays out.
Finally, I'd like to offer a little perspective for those who keep suggesting bitcoin's bubble has burst....
Did bitcoin drop greatly from it's December high? Of course. Did that, in any way, indicate the death of bitcoin? To answer that question, let's look at the log scale chart.
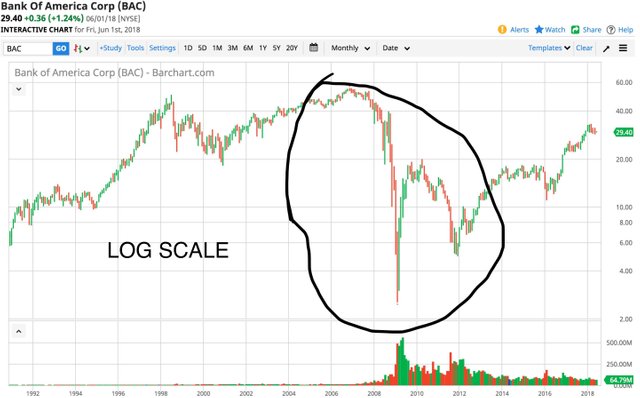
For those unfamiliar with log scale, it's basically a chart that looks at the overall percentage of a rise in price or a drop in price. This helps us determine where the REAL gains and losses took place.
Everyone remembers the housing bubble that burst in the United Stated back in 2008. This chart shows Bank of America stock from 1995-2018. You can see what Bank of America's stock looked like during the housing crash. This is what a TRUE crash (a.k.a bubble burst) looks like.
Remember, this is LOG SCALE:
Now let's compare this to the so called "crash" of bitcoin in January of 2018...also in LOG SCALE. This is the daily chart from 2013-2018 also in LOG SCALE:
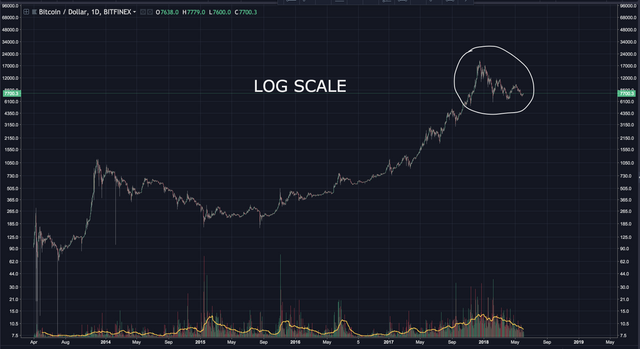
You can see how that puts things into perspective. While bitcoin had a major correction, I'd hardly classify it as a crash....not even close. Remember, bitcoin started 2017 under $900. It's currently around $7,700. Does that sound like a crash to you?
Wrapping things up...
The next major bull run will not take place without new money entering the market...the way it did in 2017. I'm convinced a great deal of interested investors are sitting on the sidelines, waiting for regulatory clarity.
Even if we do see a continued rise in price over the next week, without knowing the rules, large investors aren't going to take the leap. This will most likely result in another small rise, followed by another drop.
History has shown us that many nations look to America as a benchmark for regulating new industries. With that in mind, I'm convinced once the SEC lays out regulatory framework for the cryptocurrency, we'll see a flood of new money entering the market. Hopefully that happens sooner rather than later.
Let's see how the next 24-48 hours play out. Should be interesting. As always, stay safe, manage risk and never invest more than you can afford to loose.
BIAS:
Short Term: Neutral to Slightly Bullish
Longterm: Very Bullish
I hope this has been helpful. I’d be happy to answer any questions in the comment section below. Thanks for stopping by.
If you found this post informative, please:

Disclaimer: I am NOT a financial advisor and this is NOT financial advice. Please always do your own research and invest responsibly. Technical analysis is simply a guide. It doesn’t predict the future. Anyone that claims they know exactly what’s going to happen is foolish, lying or both. Technical Analysis should only be used as a tool to help make better decisions. If you enter a trade, I recommend having a stop loss and sticking to it. You will loose at times. The key is to have more wins than losses. With that in mind, I wish you great success.

If you don’t have an account on Binance, I STRONGLY recommend getting one. They’re usually the first to get reputable coins, have excellent security and second to none customer service. You can sign up here free of charge: https://www.binance.com/?ref=16878853
**FYI…I just started a Facebook and twitter page where I’ll post analysis, along with other relevant crypto data from myself and others. If you’d like to be notified as soon as updates reach Steemit, the twitter handle is @Workin2005 and the Facebook page is https://www.facebook.com/The-Cryptocurrency-Revolution-587441898287918

In your last chart showing the humps camel style and trend change variable outcomes, I'd relabel "bearish trend change" to "bearish trend continuation" if it dropped below. Once again, nice work much appreciated!
Thanks @eaglet. Actually, the ascending support line shows a slow, steady uptrend. If it drops below that support, the uptrend is broken. I see the confusion though...I just deleted the text.
wow,this chart is nice to see all of us.it is really a effortive for us to know about bitcoin market very easily....
really nice graphical view....
Thanks @linki555