Bitcoin Technical Analysis: PRICE MOVES AND RETAIL INVESTORS GET WISER
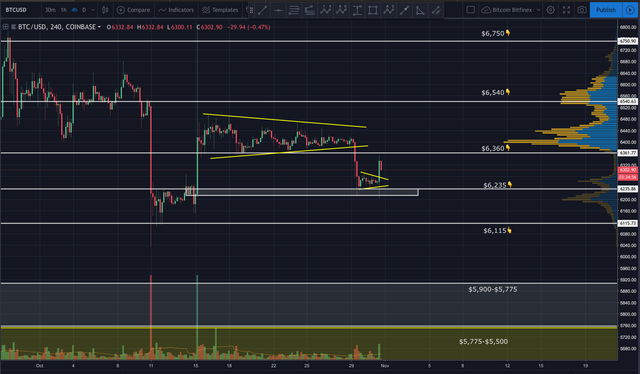
Bitcoin has been getting squeezed within a small wedge for the past 2 days. Today it broke out of that wedge in a very interesting way.
For the past month I’ve been saying until we establish a new trend, the best way to make money in this market is by trading the range. I’ve told you anything below $6,235 down to $6,115 is a good place to latter in buys (with a very tight stop). Conversely, I’ve said anything above $6,540 up to $6,750 is where I’d consider lattering into a short.
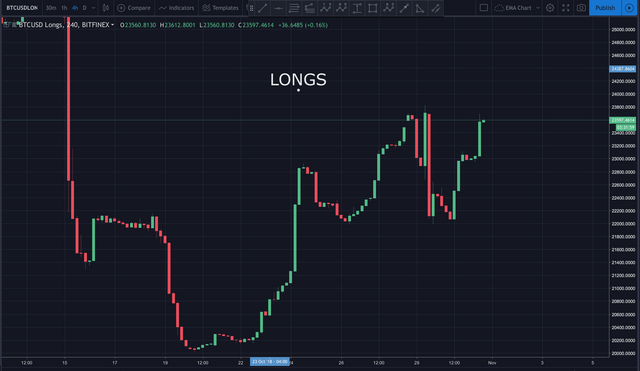
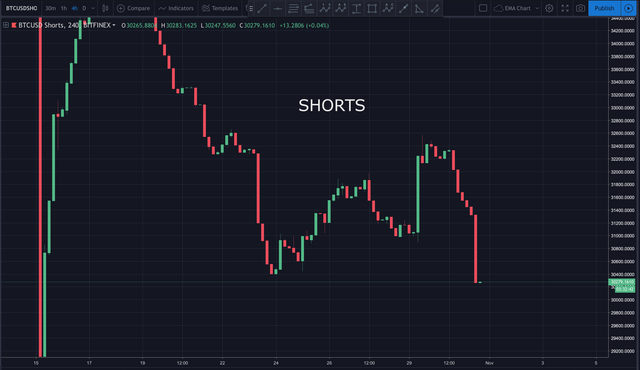
When price broke out of the wedge today, it initially dropped to about $6,200 (our buy zone). In the past, retail investors would chase price. When price dropped, they’d typically rush to enter into a short. This would usually cause short orders to stack and longs to drop. Today, we saw the opposite happen. Price dropped, and many retail investors actually closed their shorts. They took profits! We also watched long positions rise as priced dropped...the opposite of what we’ve seen in the past. This is significant. It’s a sign the market is maturing and becoming healthier. Retail investors are no longer falling for the same traps market makers have been setting all year. In other words (as I said in a prior update), we’re running out of guppies. Retail investors are waiting for a pull back to enter the market rather than chasing price. The closing of shorts and opening of longs pushed price right back up in a very healthy way.
I’m expecting a retest of the prior $6,250 order block. The way bitcoin reacts to this retest will be very telling.
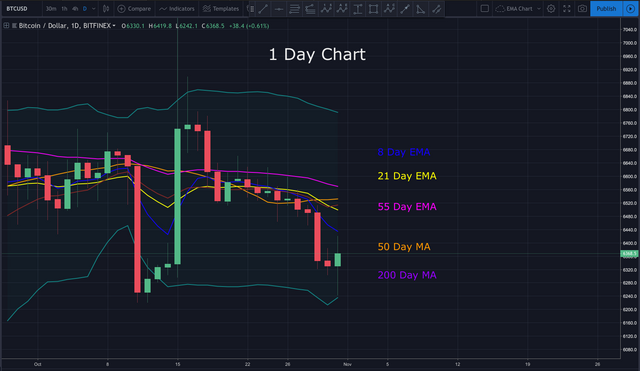
Looking at the daily chart, we can see price broke down and bounced very close to the bottom Bollinger band. We need to see price at least rise above the 8 day EMA if this momentum is to continue. A decisive break above the 21 day EMA (on the daily chart) would be an extremely bullish sign in my opinion.
In today’s video analysis I discuss, market psychology, where price may be heading next, traps to avoid and MUCH more. I hope you find it helpful.
Video Analysis:
If you don’t see the above video, navigate to TIMM (https://mentormarket.io/profile/@workin2005) or Steemit in order to watch.
I hope this has been helpful. I’d be happy to answer any questions in the comment section below. Until next time, wishing you safe and profitable trading!
Workin
If you found this post informative, please:
Open an Account on Binance here:
https://www.binance.com/?ref=16878853
Support the Crypto Ecosystem with Brave Browser:
https://brave.com/wor485
Twitter handle is @Workin2005 and Facebook is https://www.facebook.com/Workin2005
Published on:

by Workin2005


