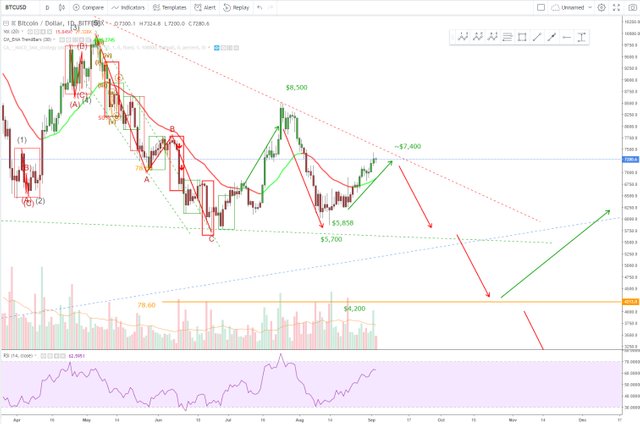
BTC/USD close to resistance line.
Bitcoin bounced off from $5,858 and reached almost 27% of gain at $7,430.
RSI is quite high, but it can make another push to 70 RSI (it's at 62 right now).
That resistance line, which is Triangle Formation upper line, is quite tough nut to crack.
I'm anticipating BTC to go lower for another check of $6,000 $5,858 $5,755 and finally $5,500-5,600 lvl. which is lower support line of that Triangle Formation.
I'm quite sure that previously mentioned pullback will happen as we have high RSI, low Volume, and market's still bearish. First major indicator (for me) would be crossing that 30d EMA line. We're still above it, but BTC is too weak to maintain that position.
On the other hand, breaking that upper resistance line (over $7,500) and sustaining stable level above it, will make me rethink my position on BTC. But it won't happen probably.

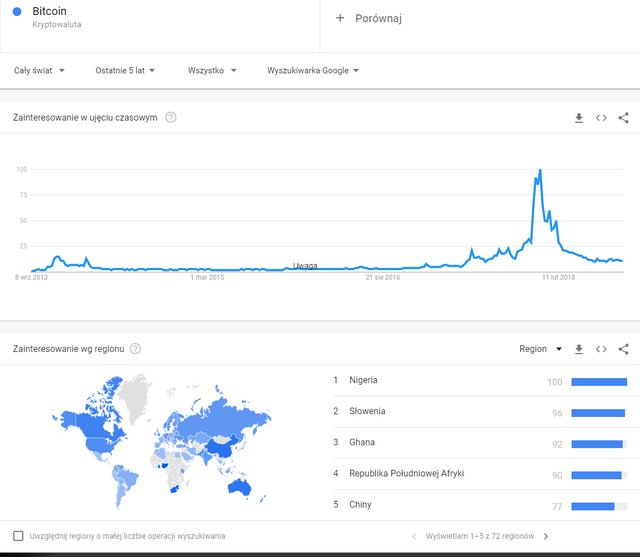
Another thing is that people lost interest in BTC after 2017. That's what Google Trends is telling me anyway. But it's still 3x as much as in 2016.

DISCLAIMER
I’m not a certified financial advisor nor a certified financial analyst. The contents posted by me are for informational and entertainment purposes only. Don't follow any analysis blindly, and make your own decisions. Always plan your trades and play with stop-loss.
If you like my charts, follow me on Twitter https://twitter.com/Woytech
or on TradingView https://www.tradingview.com/u/Voytech/
You write well, @voytech!