Binance Coin Update: And Down We go Into the Abyss... [BNB TA]
Although I tried to keep an optimistic tone and a 2-way approached, I have to admit the current price action is what I expected in my last Binance Coin post. BNB crashed, and crashed hard. Not any different from all other cryptos, but some people may have kept hope for BNB, given for example how it reached an ATH (on its Bitcoin pairing) in June, rather than last winter.
So how does it look now?

Weekly chart
We're currently in the fourth consecutive red week. The 34 EMA is visibly bearish, and I suspect it will give us downward pressure for some time. The 55 EMA is flattening and the price may get sandwiched between the two, leading to further pressure.
Any relevant targets?

Now that we had a big move, I think it is time to look at the truly broader picture, i.e. the monthly chart. She is also a mess. We departed from the 16-18k range (i.e. 0.0016000-0.0018000 BTC), so it's time to look for some new relevant ranges. PA-wise, there are a lot of potential candidate areas, so I have added fib-retracement levels as a helper. In order to not complicate life with Elliott Waves, I just considered 2 scenarios:
- that we retrace from the leg starting in late 2017 OR
- that we retrace from the beginning of (Binance Coin's) time
Either way, I like to look for the golden pocket (61,8-65% retracement) and 78,6%. These fit somewhat satisfactory over some potentially interesting areas. The price range is too huge to be helpful, but it's a good start in that direction.
Any RELEVANT targets?
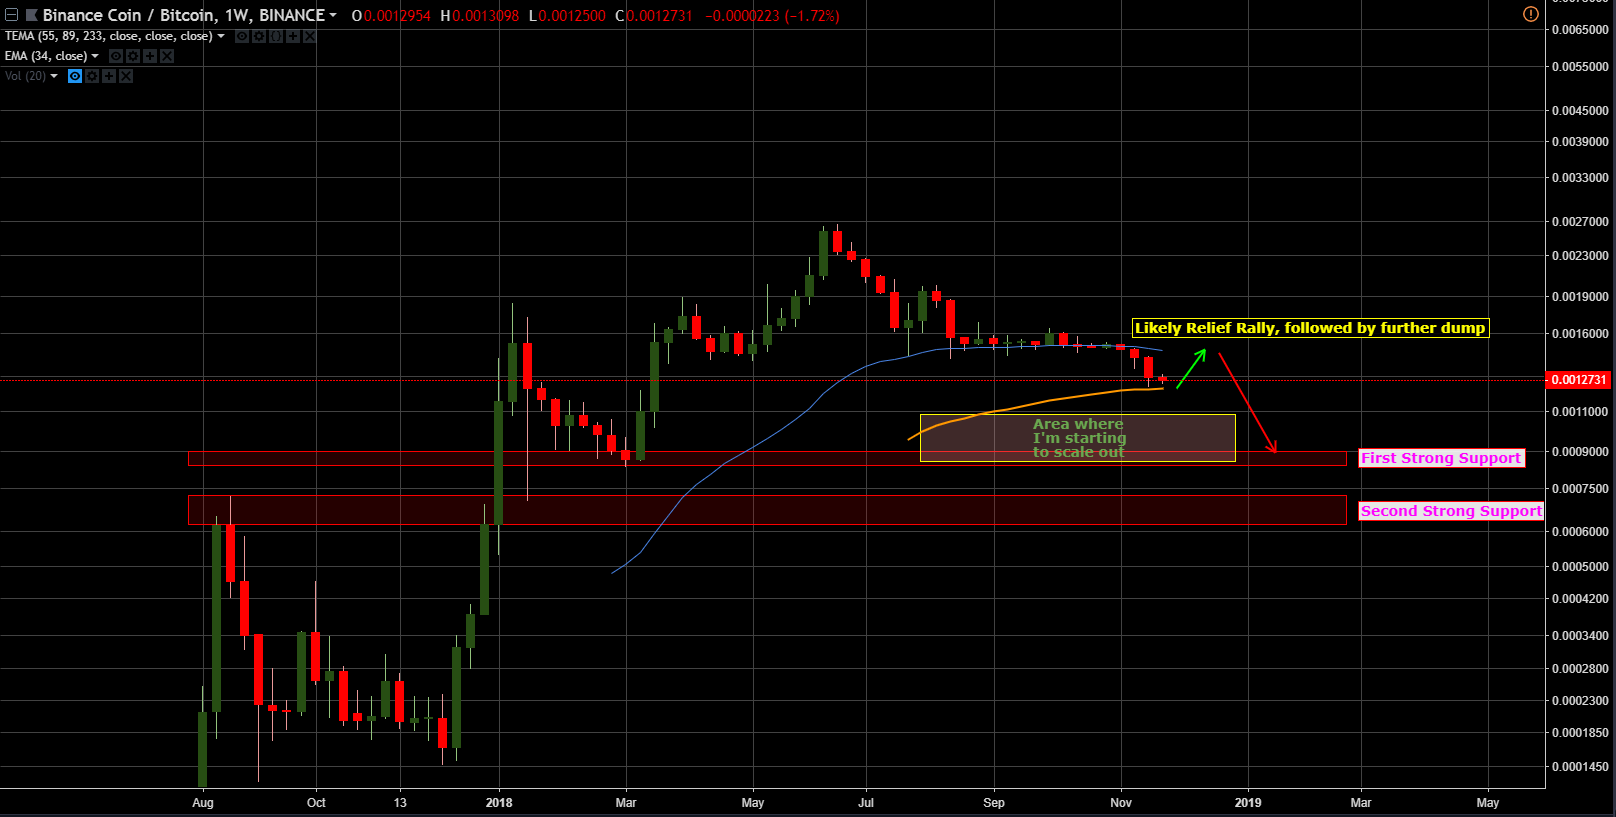
There we go! A nicer, leaner chart. Some points of interest that pop up quick are at the 8-9k (again, I'm just too lazy to write 0.0009 BTC etc) range, and at the 6-7k one. Given that they are contained within the larger zones outlined in the monthly chart, I'll take them as good. Not much going on in these boxes except being a former top/bottom, but these are the ranges to provide STRONG support in case the price gets there.
Now, to clear up the rest of my annotations:
The price almost reached the 55 EMA. All cryptos are oversold. Even if we drop a bit more, a correction up is due. I expect a bounce soon, which may take us all the way to the flat PA created during Aug-Oct, but certainly not beyond it. After that, we should drop with renewed force and momentum.
After this presumed dead-cat bounce, we'll drop but don't know where we'll stop. The fact that I see a strong support doesn't mean we'll get there! It just means that if we do get there, I see a large probability for a rebound to the upside. Therefore, I won't wait for support to be hit, rather I will scale out of my „short” (quotation marks cause there's no real short selling on Binance lol) in several steps along the way.
Of course, there's always the possibility that I'm ENTIRELY wrong and I'll just get my trailing stop-loss hit lol. But then again, when I'm looking at the EMAs on the daily chart, all I see are bear scratches.
