Averages - effective buy/ sell signals

Averages are a very useful tool used in technical analysis. They are very easy to calculate and can be used to identify sell/buy signals . In addition averages might be indicators confirming a change or continuation of trend.
There are different types of averages, but in traiding most often used are:
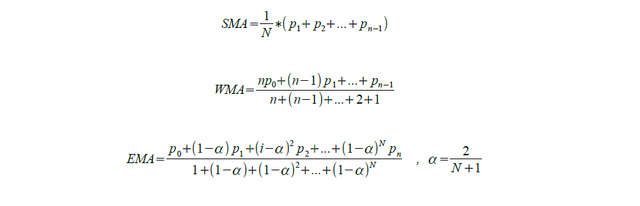
- Simple Moving Average (SMA)
- Weighted Moving Average (WMA)
- Exponnential Moving Average (EMA)
What is the difference between those averages?
I will try to explain this in very simple words and present it on charts.
Simple Moving Average (SMA) is used to recognize a new trend or to reverse in already existing trend. SMA is NOT A LEADING INDICATOR. It means that we use it only as a confirmation! 10 days SMA will be keep closer to the price than the 50 days SMA. Short term SMA can give buying/selling signals much more often.
Weighted Moving Average (WMA) is an indicator in which different elements have different weights. This is because heavier elements have bigger influence on the average. WMA takes into account the average period.
Exponential Moving Average (EMA) gives extra weight to more current prices, so the distance between average and price is much smaller, than for SMA and WMA. . As a result the EMA is more sensitive to price changes and responds faster than the SMA graphs.
.png)
Types of user averages
I will use only SMA in this paragraph.
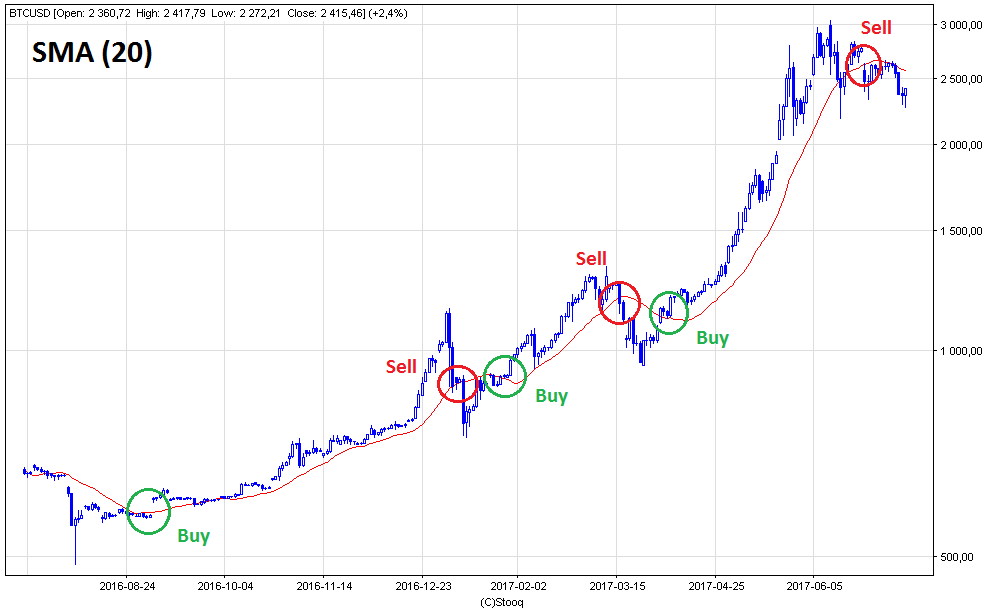
1 average
Note that the average for the up trend is below the chart, while the down trend is above the graph. The signal is the crosscut average with the price graph. The average that raises the graph from the top indicates an increase, when it raises from the bottom - a drop.

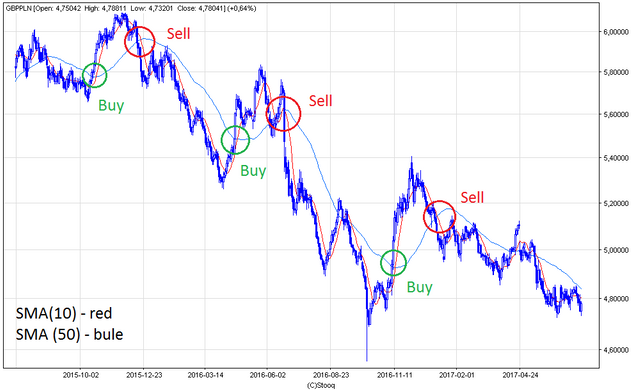
2 averages
Most commonly used are 2 and 20 days, and 10 and 50 days. Breaking faster average over the top by slower means growth. In the opposite case a drop. When the slower average cuts through the faster average on top, this indicates growth.

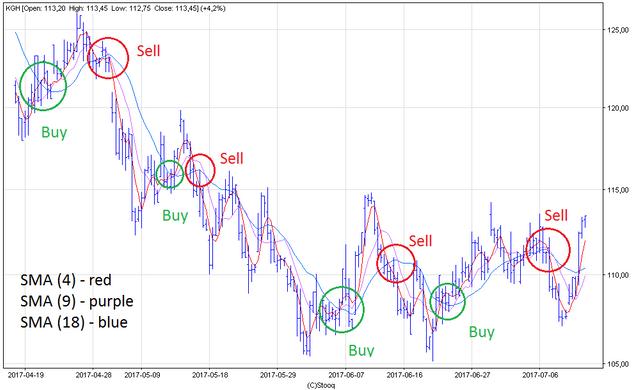
3 averages
Most commonly used are the average 4, 9, 18. In the upward trend, the order should be as follows. The 4-day average is above the 9-day average, which in turn is above the 18-day average. In the downward trend, the order is reversed, for example the lowest is the average 4 days, above it 9 days, then 18 days
Have you ever heard about dead cross or golden cross?
Golden cross It rises when the short-term averages cuts from the bottom long-term average and is a buy signal.
Dead cross is a sale signal which is generated when the short-term average cuts the long-term average from above.
Other uses of averages (more details in the next article)
Bollinger Bands - This is a technical analysis that uses the moving average and their deviations. It is made up of 3 webs, two of which are external once. I will discuss this indicator in the future
MACD Oscillator - This is a measure of the convergence and divergence of moving averages. It is built from the It is built from the MACD line for example the signal line and uses EMA . I will discuss this indicator in the future.
Great article as usual. I'd really like to read about RSI and Ichimoku
Amaizing post. I was just searching an information about Averages and how to read effectively for buy/ sell signals. Hope you'll continue writing post like this. It is very important to educate newcomers on trading cryptocurrency and make a right decision when buying different crypto
Great post, explained very well, moving averages and fibs are my two most important tools that I use.