Price movement in the ADA/BTC trading pair on the background of bitcoin price fall.

Hello, gentlemen..
The price of bitcoin fell, as a result of this, the price of altcoins began to fall. I want to post a few short posts on the price movement of some of altcoins.
ADA/BTC, "BINANCE", 1 day timeframe
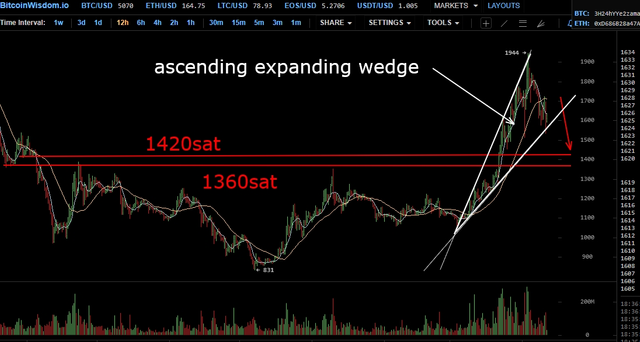
On the exchange chart of the coin, the pattern "ascending expanding wedge" was formed long ago. This pattern warns of a possible price fall down after the breakout of the lower limit of the pattern.
The ADA/BTC exchange chart shows the price corridor (1360 sat - 1420 sat). It is marked in red. If the price falls (this possibility is estimated at 80 - 90%), the price will reach these limits.
At the time of writing, the price of the asset may again start a small rise inside the pattern marked in white. But in the end probably fall to the above boundaries.
Good luck!
The @upvoteinvest team
A formal disclaimer
Some of the posts might contain our opinion on trading strategies based on our technical and fundamental knowledge. However, please, invest at your own risk. We can’t be held responsible for any losses.