General analysis of the situation on the trading currency pair XMR/BTC

Hi, friends!!
Knowing that the price movement of any financial asset on the stock chart adheres to certain lines of support and resistance, it is relatively easy to calculate this movement for a certain period of time, using a sufficiently large time frame. However, I am not talking about price accuracy at a specific time. I'm talking about understanding the trend, as well as calculating the upper and lower limits of this movement
XMR/BTC "Bitfinex" exchange, timeframe 3 days.
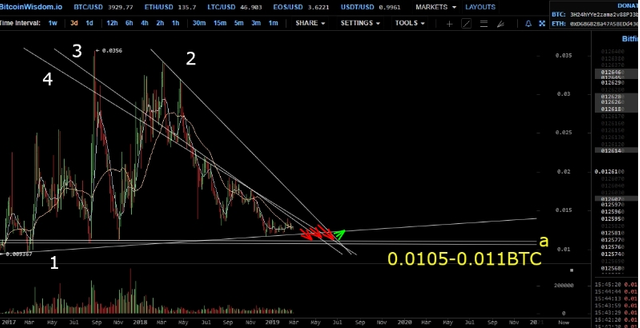
Main lines:
__basic bullish support line (1)
__ main bearish resistance line (2)
__local resistance lines (3, 4)
__ price support corridor (a) 0.0105-0.011BTC
An experienced trader will see on this chart the upcoming strong pressure from above. Ahead of the two local resistance lines (3, 4), followed by the main (2). It can be assumed with a high degree of confidence that the price of the coin will decline for more than one month. First of all, this is due to the upcoming decrease in the price of bitcoin. The support corridor (a) is quite powerful. For several years of trading on the exchange, the price of the coin has twice started its rise from these positions. I think that the price of the asset and this time will fall to this level and it can happen within two months.
This analysis is General and is of interest to those investors who are not engaged in exchange trading, and are interested in investing for a long time. If you are interested in the XMR coin as a profit making project, the best buy time will come in mid-June when the coin price drops to 0.01 0.011 BTC.
Good luck!
The @upvoteinvest team
A formal disclaimer
Some of the posts might contain our opinion on trading strategies based on our technical and fundamental knowledge. However, please, invest at your own risk. We can’t be held responsible for any losses.