ETH/BTC. Positive dynamics before the trend change.

Hello, gentlemen..
Apparently, the time approaches for the growth of ETH.
Consider the stock chart of the ETHcoin with a timeframe of 1 day. Exchange "Bitfinex".
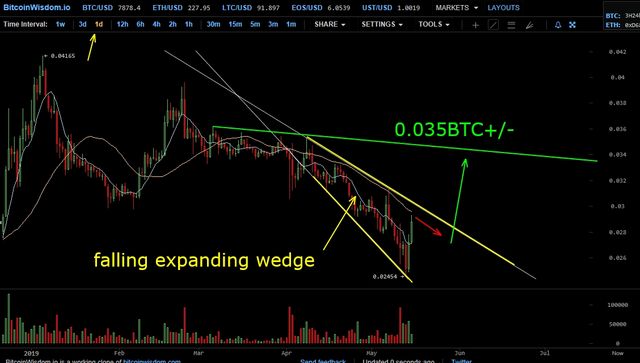
While the price of bitcoin rose, a pattern of "falling of the expanding cone" was formed on ETH stock chart which heralds change of trend. Reaching the upper boundary of the pattern at the level of 0.03 BTC price will likely adjust, then begin a new rise.
The upper limit of growth will be a strong resistance line, marked in green in the figure. Most likely, the ETH price will touch this line at 0.035 BTC+/-, followed by a rebound. From this moment on, the ETH token will be in the phase of consolidation of funds in anticipation of the rise.
I ask you to take into account once again that the chart is presented from the exchange "Bitfinex", timeframe 1 (one) day.
Good luck!
The @upvoteinvest team
A formal disclaimer
Some of the posts might contain our opinion on trading strategies based on our technical and fundamental knowledge. However, please, invest at your own risk. We can’t be held responsible for any losses