BTC/USD. A good example of a sequence that helps to analyze the price movement.

Hello, gentlemen..
Knowing that the movement of financial assets on the charts are subject to certain sequences, with a high degree of confidence it is possible to predict the further movement of the BTC price in the near future.
"Bitfenix", timeframe 6 hours.
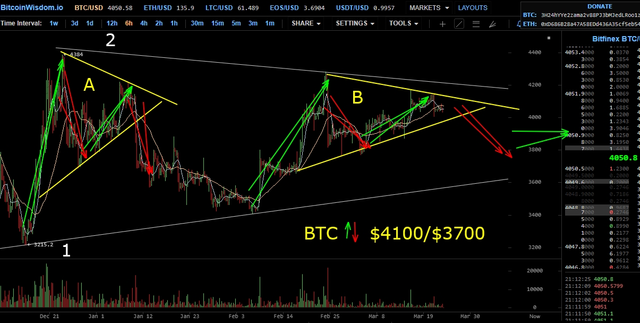
Pattern A - BTC price movement from December 15 to January 10. At the end of the pattern A the price broke through the lower line of the pattern and gradually fell to the support line 1
Pattern B - BTC price movement from February 8 to the present time. In the coming days, we should expect the price to fall and the breakdown of the lower resistance line of the pattern.
The whole difference is that when the price moves sideways in a certain corridor, the price each time rises and falls more smoothly, like a damped sine wave. Therefore, further price movement will occur between the levels of $3700 / $4100, gradually leveling off in the price corridor of $3800/$3900.
My personal opinion - judging by the fact that the lines 1 and 2 form a narrowing wedge lying on its side, the market has not yet decided on the price of BTC for the next month or two. Such a prolonged lateral movement often ends with a fall in the price. I believe that in the summer we can see the price at $3000/$3200.
Good luck!
The @upvoteinvest team
A formal disclaimer
Some of the posts might contain our opinion on trading strategies based on our technical and fundamental knowledge. However, please, invest at your own risk. We can’t be held responsible for any losses.