BCH/USD. Estimated level of price drop.

Hello, gentlemen..
On the exchange chart BCH/BTC, a pattern known to us was formed - "an upward expanding wedge"
"Exmo" exchange, 1 day.
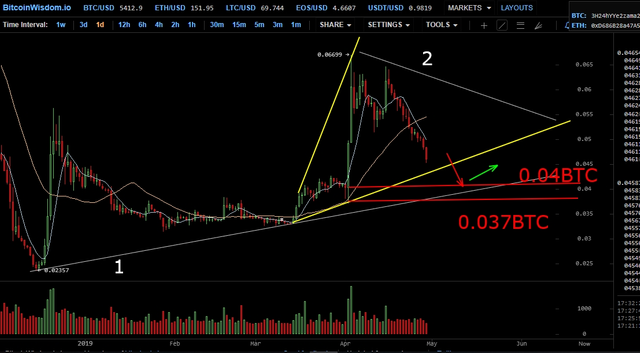
The figure shows the main support and resistance lines (1, 2)
Yellow lines form the upper and lower bounds of the "pattern". We know from experience that this pattern foreshadows a price drop. The probability of such an outcome is 90%.
The red lines show the price corridor, which can be reached by the token price when it falls. This is the level of 0.037 BTC - 0.04 BTC.
This option is considered in the light of the alleged short lateral movement of bitcoin against the dollar.
Good luck!
The @upvoteinvest team
A formal disclaimer
Some of the posts might contain our opinion on trading strategies based on our technical and fundamental knowledge. However, please, invest at your own risk. We can’t be held responsible for any losses
N-Person Prisoner’s Dilemma