Becoming a Profitable Trader With Technical Analysis PART TWO - Charts and Patterns

Hello Steemians!
Today I am going to continue with part two of the becoming a profitable trader with technical analysis series and I am going to talk about charts and chart patterns. There are a lot of different patterns that exist in the charting world and I will highlight the major ones and tell you how to effectively use them in the real world. I will update the outline daily with links to the previous posts.
Becoming a Profitable Trader With Technical Analysis
Part One: Philosophy and Risk
Part Two: Charts and Patterns
Part Three: Indicators
Part Four: Strategies for Short Term and Long Term
Part Five: Analyzing Popular Steemian's Techniques
Charts
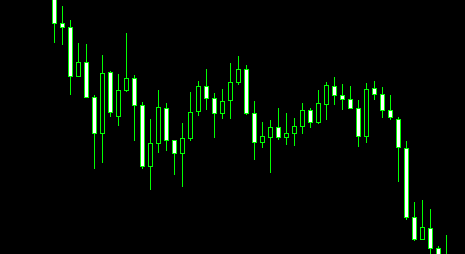
There are several types of charts you can use to analyze an asset but by far the most popular is the candlestick chart. This type of chart was developed in the 18th century by a Japanese rice trader and has become the standard for trading any type of financial instrument. Listed below are all the different types of charts:
Candlestick Charts
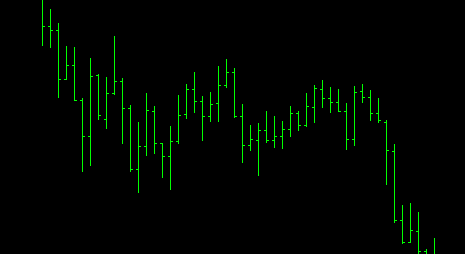
Bar Charts
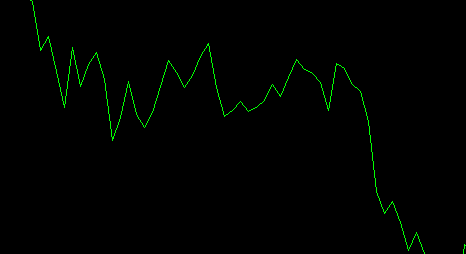
Line Charts
Setting Up Your Chart
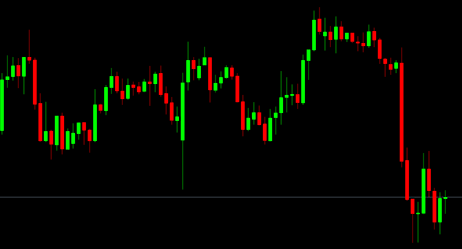
It is important to set up your chart in a way that is comfortable for you eyes, I prefer a black background with red and green candles with full colored bodies but try a few things out and see what you prefer. You also have the option to have a grid overlay on your chart but I always keep this shut off as it keeps the screen less cluttered.
Support, Resistance, and Trend Lines
Before getting into the patterns I want to talk about the three most common concepts that arise when anyone talks about technical analysis. All three of these concepts have psychological factors that contribute to making them effective tools and I will explain them below.
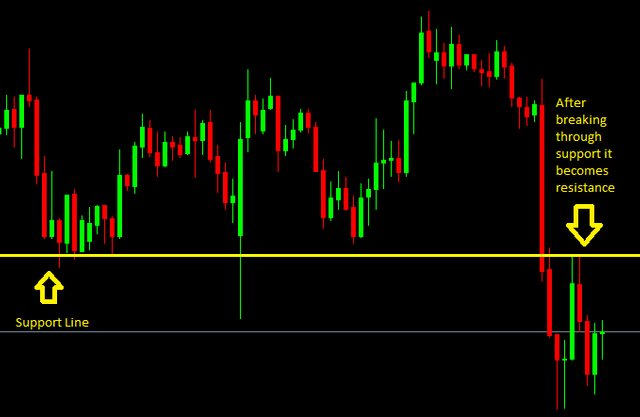
Support
Support is the concept that the movement of any asset will reverse at predetermined prices based on the price hitting and reversing around that same point in the past. Support lines can be drawn on any chart where you see the price bounce down and reverse at the same point multiple times. If the price continues breaks the support line then it is considered a breakout and is a usual indicator of a continued downward trend. Once the support line is broken it may become a resistance line.
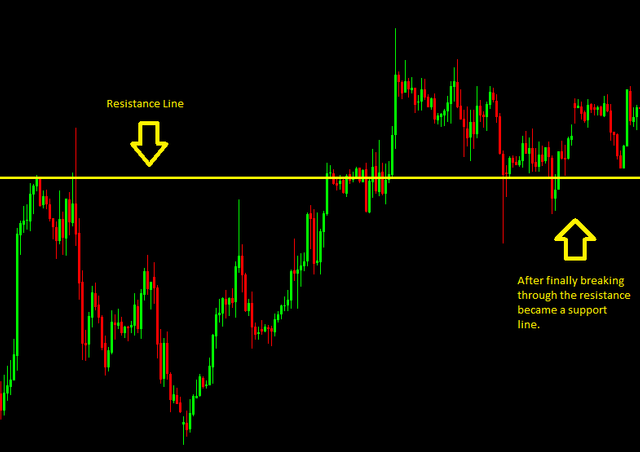
Resistance
Resistance is the inverse of support, it occurs when the prices rises to previous heights and reverses back down when it reaches previous heights. When the resistance line is broken it is a good indicator of a breakout in the upward direction and the resistance line may become support.
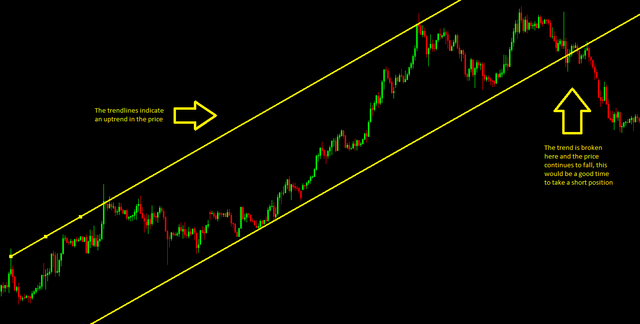
Trendlines
Trendlines follow the same principles as support and resistance only they are not just horizontal lines. They are diagonal lines that touch multiple points in the chart and give you a general idea of whether you are on an up or down trend, they can also be drawn as parallel lines called a price channel. The same principle applies as it did with support and resistance, if the line is broken then the chart is breaking out and generally will continue in whatever direction it break out in.
The most important thing to note about these three concepts is the more times the price approaches the line the stronger the trend, if it just touches a few times then it is considered weak.
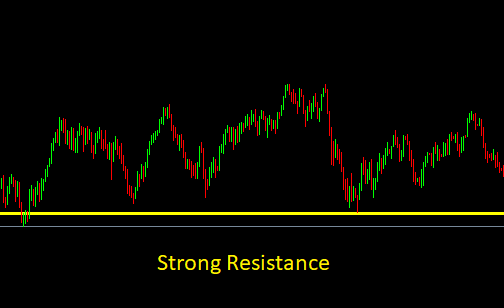
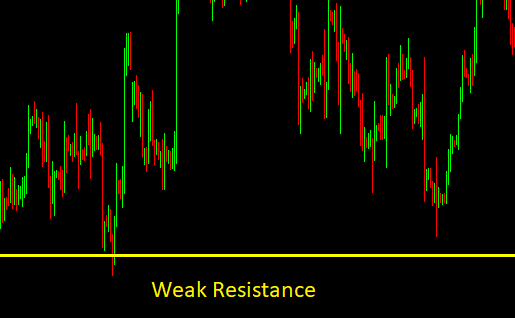
Chart Patterns
There are literally hundred of chart patterns that can occur in any chart but I will only cover the most important ones in this post. I will link to a few courses that will teach you all of them at the bottom of this post so if you are interested you can learn more on your own outside these posts.
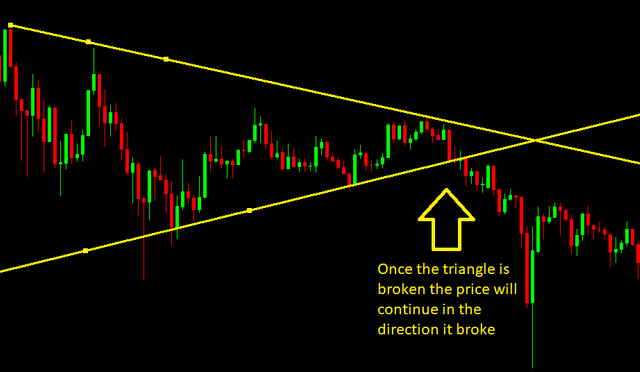
Flags, Pennants, or Triangles
This is one of the most useful chart patterns to learn in my opinion because they are very common during periods of consolidation (when the chart is just moving sideways and not really up or down) when the trend lines above and below converge into a triangle shape. There are multiple names for this depending on the circumstance like ascending or descending triangle and bullish or bearish symmetric triangle and they have slightly different conditions but they are all essentially the same. The low points are trending higher and the high points are trending lower so when trend lines are drawn they meet in a triangle shape. For example, if the chart was in a down trend and the market was bearish, the bulls will try to fight back causing higher lows and the bears push back causing lower highs and eventually the market sentiment changes and the bears will win out.
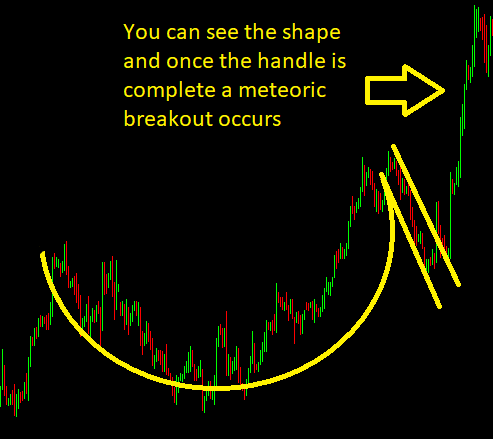
Cup and Handle
This is a pattern that I see come up in quite a few Steemit posts and while I don't often use this one, I cannot deny that it is effective. This is a continuation pattern that occurs when the market slumps over a period of time and then starts to rebound followed by a small slump then a significant breakout. It takes a little more practice to identify but if you spot one then you will most likely benefit from it significantly.
Head and Shoulders and the Inverse
This is one I see a lot on Steemit, people saying the chart is a set up for a head and shoulders and sometimes they are right but often the parameters don't fit and the pattern doesn't apply. This is a reversal pattern that doesn't happen cleanly very often so it isn't always easy to spot but they are out there. It happens when the price rises then falls then rise to a new height and then falls back to the previous low and rises once more before reversing to a down trend. It sounds a bit confusing so here is an example:
As you can probably guess the inverse head and shoulders pattern is a reversal from a down trend to an up trend and works essentially the same way but reversed.
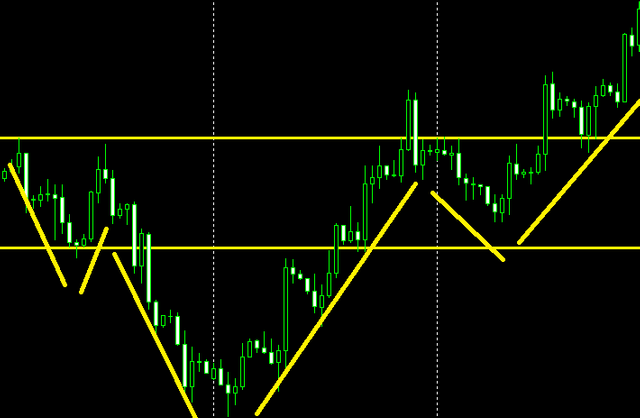
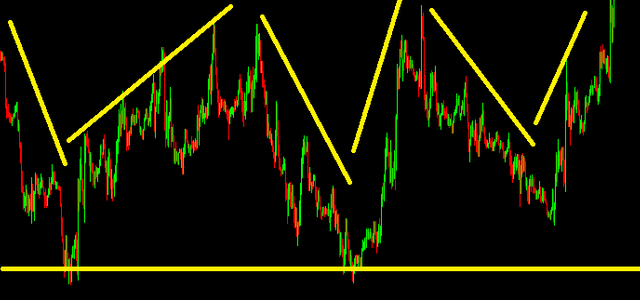
Triple Bottom
The triple bottom is another reversal pattern that represent the bears in the market attempting to drive the price down and slowly losing. It is three separate drops to approximately the same price level before shooting up and breaking out. This one is a lot easier to find in shorter timeframes where the fluctuations in price are much more significant and when it starts to form start checking for secondary confirmation of a breakout.
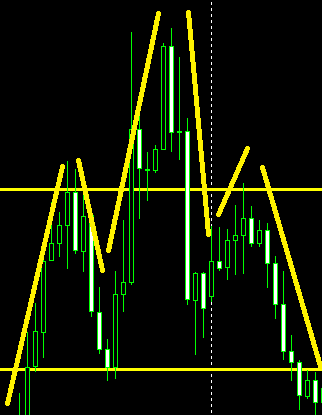
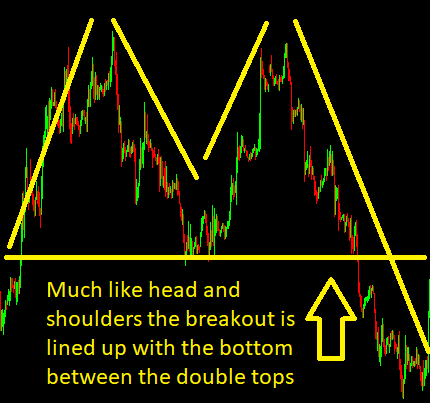
Double Top
The double top is pretty much the inverse of the triple bottom. It is a reversal pattern that signifies that the price will soon drop after it's climb. So basically the bears in the market are fighting the bulls to drive the price down and are slowly winning. This is a pretty common pattern so you shouldn't have much trouble identifying it in most of the timeframes.
What's Next?
Well there are loads of resources online to better your understanding of chart patterns and you will learn that there are so many different candle patterns it can make your head spin. I have highlighted the most important ones above and should you want to continue your education in charting patterns I recommend these resources:
- Baby Pips Forex School - This is a forex based school but once you get past the first section the information can be applied to any type of trading from crypto to securities LINK
- StockCharts Chart School - This class focuses mainly on charting techniques and everything you could ever want to know is here. I highly recommend this one LINK
- Analyzing Chart Patterns at Investopedia - Honestly, Investopedia is one of the best resources for anything related to trading but this page will go over all the details of charting patterns LINK
The most important resource is...
PRACTICE!
Make yourself an account at TradingView and get practicing identifying patterns in any chart you want. Whether it's crypto, stocks or anything in between, there are humans at work in all of the so patterns will always arise. Just stay focused and you will get there with a little trial and error and lots of practice. Tomorrow I will cover all the essential indicators that take a little bit of the guess work out of trading. Thanks for reading!
All of the charts in this post were generated in MetaTrader 4 by me and not from any outside sources. I did this to show the readers real examples and not just drawings of each instance.

Great post. We can tell you put a lot of works on this post. Very well and keep going .😁😁😁
Another great post. Thank you @travelstheworld, things are starting to make sense. This is really starting to help me do my own research/analysis on AltCoins that have been recommended to me. I've already made some profit (albeit only a small amount)!
I appreciate that! Chart patterns are important but its easy to get hung up on spotting them, ill cover indicators tomorrow and im sure it will really start to click. Glad you are making profits in the down market though, lots of people are struggling these days
Like I said, they're only small. I don't want to put a significant amount of money in while I'm still learning, and I never want to put in more than I'm willing to lose! But, profit is still profit at the end of the day. It's percentages I'm focussing on at the moment, not necessarily the real world value, yet.
I do think the markets could very well reverse and start growing again soon, but I'm preparing for things to keep falling and looking at it more as a time for accumulation and overall portfolio growth.
Yeah thats a wise choice, I started by making demo accounts with various brokers and playing a serious game with the fake money until my technique and strategies were on point. I know the market will turn around soon, it has to, the market needed a correction but no matter how big the correction it cannot take the potential from the tech and the big players know that.
That's exactly the point I try to make when I explain this whole thing to people who know nothing about it! It's not the cryptocurrencies themselves that are the exciting part, It's the technology they're built on and the potential real-world applications that THAT has that makes this space so interesting and will make it sustainable long-term,
Totally agree, blockchain is here and it will not go away no matter how much some people want it to. Whenever there is a big change in the world everything gets fucked and everyone over reacts but it eventually settles down and works. Like when Nixon took the US off the gold standard, the world went nuts but now it is probably the best financial move of the last 60 years by the US government
is the best your post brother...
You got a 0.83% upvote from @postpromoter courtesy of @travelstheworld!
Want to promote your posts too? Check out the Steem Bot Tracker website for more info. If you would like to support the development of @postpromoter and the bot tracker please vote for @yabapmatt for witness!
Congratulations @travelstheworld! You have completed some achievement on Steemit and have been rewarded with new badge(s) :
Click on any badge to view your own Board of Honor on SteemitBoard.
For more information about SteemitBoard, click here
If you no longer want to receive notifications, reply to this comment with the word
STOP