ETH Analysis 5/15 ETH-USD
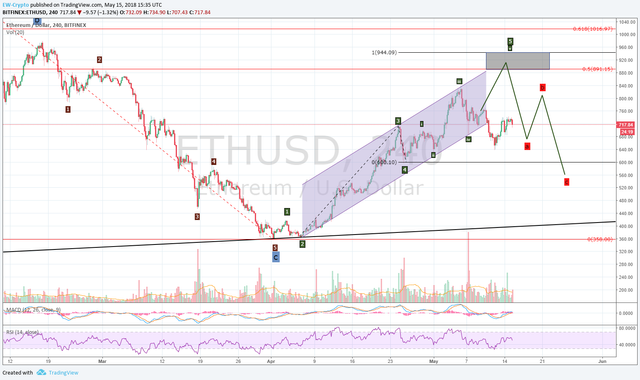
Unfortunately, ETH / USD did not do us the favor of generating a final high in the gray area. The price could not swing up again after touching the lower trend channel line.

For that reason, I also take a break from this wave counting and let ETH correct itself to the end. The expected sub-wave v has not been released and it is almost unlikely that it will come. In any case, the correction in this wave degree (i, ii, iii, iv, v) has already progressed so much that such a count is actually no longer suitable.

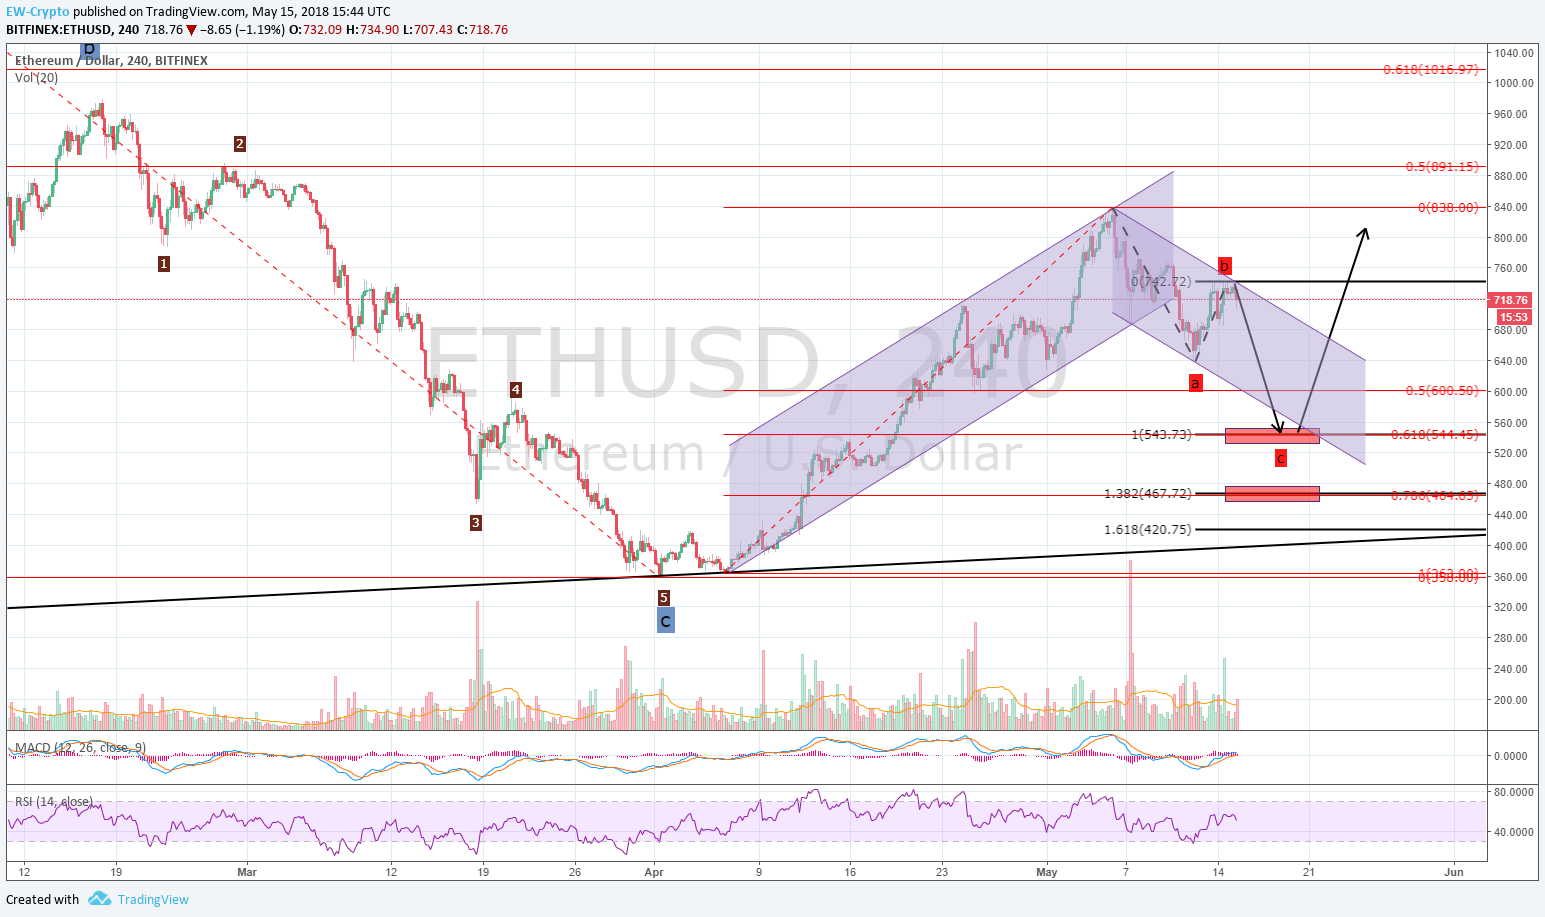
On the second image, a downtrend channel has been inserted where the correction follows a regular zig-zag pattern (abc). Should the established last interim high at $ 743.00 no longer be exceeded, there is an increased probability that the price falls back into the $ 545.00 - $ 535.00 range.
In the worst case, $ 470.00 - $ 460.00 is expected. But at least there should begin a bottoming and steer the price in a counter-movement. The two areas are marked red in the screenshot. These are typical Fibonacci clusters, which are often used by market participants as entry points.
This is NOT investment advice and does not require buying or selling. Every reader is aware of this and makes their own investment decision with their own understanding of risk management!
Cheers Jessy