The Trader’s Toolset: Fibonacci Retracement levels
Except for all the Bcash hysteria the markets have been kinda quiet recently as we’re seeing a re-accumulation in a lot of altcoins and Bitcoin testing all-time-high prices again. So it seems to me like the perfect time for some trading teaching.

The Crypto markets are infamous for their volatility and the best technical analysis can be swiftly deprecated by any news event creating FUD or FOMO, but we trader do NOT fear volatility because we make a living from it.
Technical analysis though is not a slave to volatility and I’d like to show you a very useful tool which I use in high volume crypto markets like Bitcoin, Ethereum and other major altcoins to decide my entries and sell targets.
This tool is called the Fibonacci Retracement levels (Fib levels for short) and its mathematical principles were discovered by this man, Leonardo Fibonacci, medieval genius and expert mathematician.

Now in trading, Fib levels look like this:

Behind these lines lies a great power though: Fib levels help shaping the architecture of most crypto markets.
What kind of voodoo sorcery is that you might ask?
Well most professional traders -the smart money- use Fib levels as a tool to plan their trades and since the smart money controls most of the volume in crypto markets thus crypto's price action usually respect fib levels.
Now let’s have a look at what Fib levels look like in Bitcoin. I’ve chosen to use BitcoinWisdom.com for this tutorial since it’s free and very reliable so perfect for the casual trader/investor.
Which chart should I use to draw my fib levels on.
Use the market mover, that is the market with the most liquidity. This can be found on the Markets section of BTC on CoinmarketCap.com.
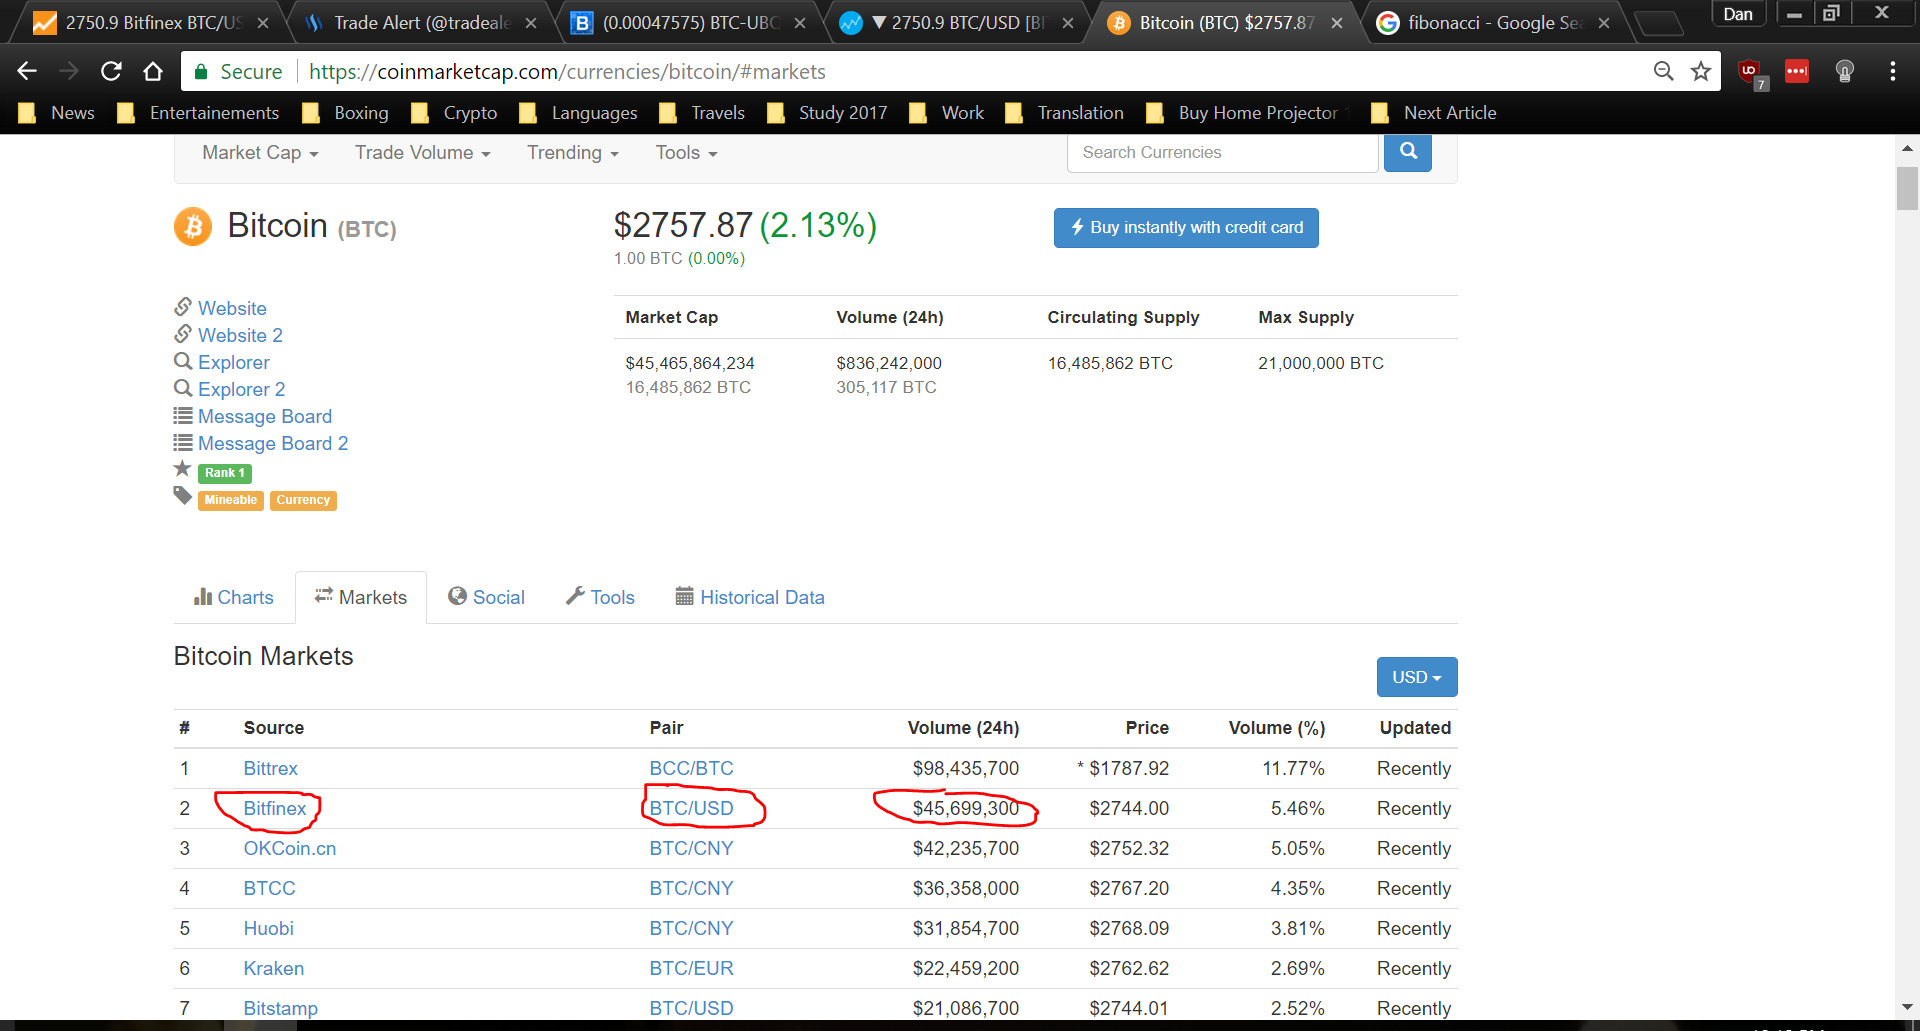
As you can see here, Bitfinex is currently (and most of the time) the market mover for the BTC/USD pair.
Now head over to BitcoinWisdom.com, select the Bitfinex market on the 1D time-frame and click on the Fib levels tool (three parallel lines stacked on top of each other):

How to draw my levels.
In Bitcoin, Fib levels work best on the larger time frames, that is 1D to 1W (I also use the 1H time frame for altcoins).
To draw your levels start (click) at the highest point of the time frame you want to analyse and draw your levels down to the next (chronologically) lowest point on the chart (and click a second time there):

MAKE SURE YOU MEASURE FROM THE TOP OF A CANDLE WICK TO THE BOTTOM END OF AN OTHER CANDLE WICK.
Wick to Wick...simple.
As you can see the price literally bounces around the fib levels and it gets even more obvious on the longer time frame.

See how the price comes in contact the fib levels and seem to bounce off of them, well that’s the magic of fib levels. Of course it’s not always perfectly clean because during major dumps FUD will usually push the price through some fib levels but in general Fib levels are a very powerful tool that can help you decide where the price is likely to rise/fall to next.
Now, unfortunately Bitcoin Wisdom’s Fib tool is quite limited because it doesn’t show the levels above the 100% line (the highest of the line on the chart) so I recommend using TradingView charts (which are free) or, for those really serious about trading: Coinigy which is hands down the best professional charting/trading tool on the market right now.
Fib levels to trade bounce plays on altcoins.
Fib levels are particularly efficient in day-trading when you’ve been buying an altcoin on a big red dump candle and you’re looking for a target to sell your coins for a quick trade (20%, 30%). In general, a coin that has been dumping hard will usually bounce back (like if you drop a tennis ball on the floor...it will bounce), touch a fib level (usually 0.618 or 0.786) before roll ing over and hitting new lows.
Here’s a perfect example with Stratis on Poloniex during the altcoin dump of a few weeks ago:
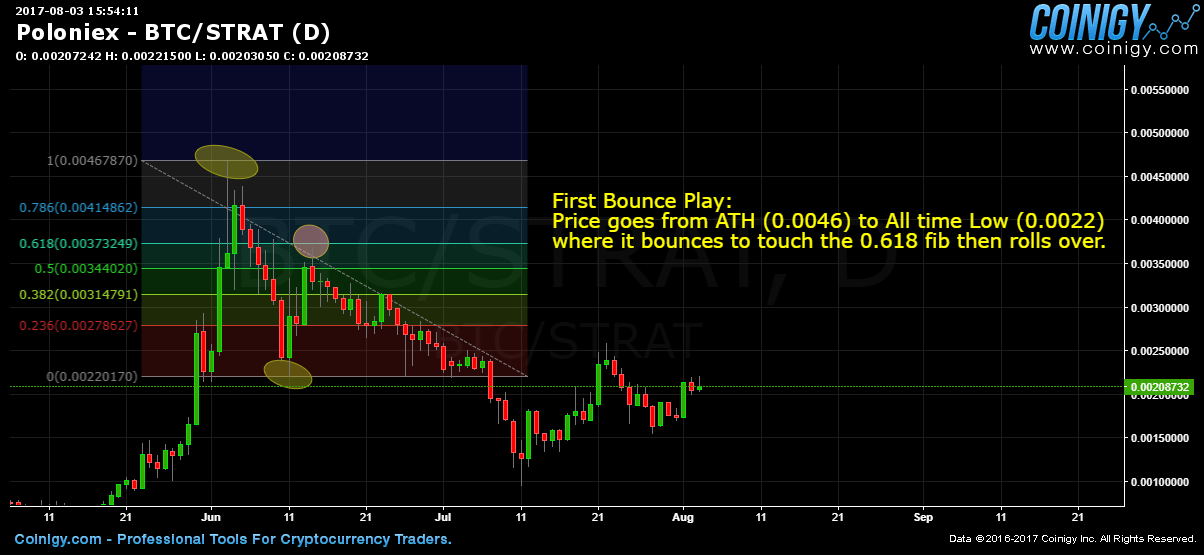

See how the two bounces played out exactly in similar fashion for Stratis, well the same principles apply to most altcoin markets too, go look at the chart and play around with Fib levels.
That's it for today guys, please leave questions in the comment section if you'd like me to clarify anything, as usual I’ll do my best to answer all of your questions.
Trade safe guys, and please follow and upvote if you like the content.
Dan @tradealert
Nice man , thank you @tradealert i'm new in to trading but i find this guide very usefull.
Fibonacci's series is everywhere , in nature , withing ourself , and even on markets as i can see.
FOLLOWED waiting for more posts like this one
Thanks @silviu93, welcome to the community, please feel free to browse through my old content, I've made loads of tutorials on how to trade smart and so forth :)
Congratulations @tradealert! You have completed some achievement on Steemit and have been rewarded with new badge(s) :
Click on any badge to view your own Board of Honor on SteemitBoard.
For more information about SteemitBoard, click here
If you no longer want to receive notifications, reply to this comment with the word
STOPTHx Bot!
hi,
which chart-software do you use in order to utilize fibonacci tool?
It's very interesting, as very bigginer of trading on cryptocurrency, I like it
Where do I find the Fibonacci Retracement tool in Coinigy ? I can't find it in the list of indicators.
Hey @balazsbohonyi, look for an icon that looks like a fork/trident on the left, click on it, the fib tool is there.
I would however recommend you use BitcoinWisdom (free website, easy to use) to draw your fib levels when trading Bitcoin, i find that doing charting there is way more accurate.
Cheers!