Steem Creates Double Bottom - is This a Buy Signal?
This is a short post with just a few essentials.
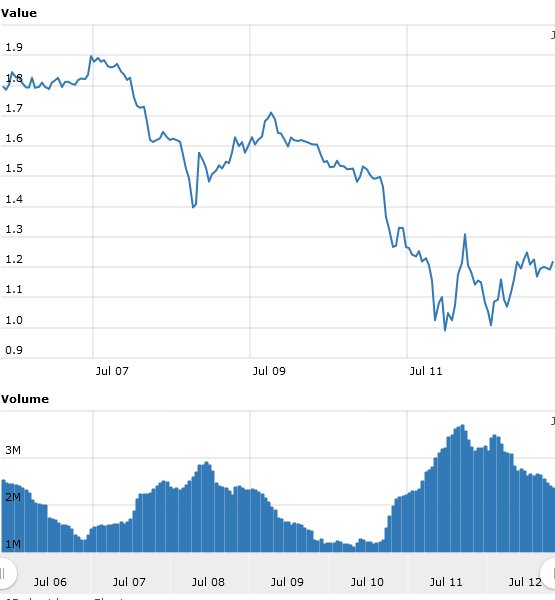
Look at the chart below, taken about 5 minutes before this post was published. Notice the double bottom shape as the price tested the USD 1.00 level. However, also take a look at the volume of trades at the foot of the graph.

Chartists tend to look at the W-shape of a double bottom as a positive sign that the price has tested a support level twice and is about to rise off it. However, such a pattern is strongest in short to medium term charts spanning up to 2 or 3 months. This pattern in an intra-day chart needs to be treated with some caution.
The thing is to also look at the volume of trades. A true rally from a support should see increasing volume. However, as we see in the chart above, the volume is drifting lower; people are unsure if this is truly a buying opportunity or a kind of dead-cat-double-bounce!
So, do you actually need to decide whether to buy or sell at this point? If you are thinking of selling, I think this is way past the sell indicator, so hold on. If you're thinking of buying and want the best price, then wait for the volume to pick up at around $1.3-1.4 or it may retest the $1 level. To do anything now, in that market. is just a 50-50 guess.
And don't forget that Steem has a platform and a growing user base - something few other cryptocurrencies can truly claim.

From a classic chartist perspective, it looks like a cup-and-handle formation. (potentially)
Of course, due to the subjective nature of charting, it could also fit into a larger winding triangle with an apex around ~$1.10.
The first scenario implies a breakout, the second is more of a lower-volatility formation that culminates in a breakout as well.
The problem of course, is determining if that breakout is going to be positive or not. I haven't been charting it enough to say.
I'm also not entirely sure that traditional chartist tools will always work with a price for an asset that accumulates; in that a flat price could still see an increase in market cap. It was a reaction to the Buy! Buy! Buy! slogans.
I used to teach maths to market traders in the City - quite a few years ago - that was fun!
Price patterns aren't totally reliable, I agree. I just wanted to give you a quick assessment without going too much in depth. I have reservations about the Steemit token, particularly its tendency to dilute its users with issuance and the attempt to correct this with a reverse-split.
Guess we'll see what happens.
Hmmm I was never big on math but my gutt feeling tells me to hold on and continue to ride probably down first but up again. Nothing changed in the cryptoworld to me 🙀🙈
Nice to meet you!
Yes, and as we can see as I write this, my advice remains true (2 days later). There is a wall of possible purchases of SBD at $1 within Steemit's internal market, although that will not appear in the crypto markets as internal transactions do not go through an exchanger.
I noticed this myself ....I am still learning ....
Thank you for taking the time to gather and posting your helpful information. Well done.
Thanks, glad you appreciated it.