Can Ripple Maintain This Bullish Momentum? XRP / USD 10 October Technical Analysis

Ripple Price Analysis
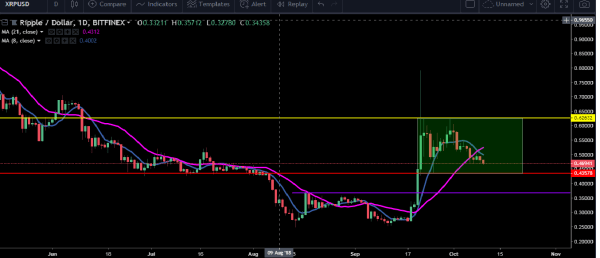
September 18, 2018 is the day the Ripple (XRP) rose dramatically from the price of $ 0.27, rising to the highest price at $ 0.79 on September 21, 2018. Since then XRP has begun to experience a period of price consolidation to date.

In terms of technical analysis, the picture above shows a very good momentum that allows the beginning of an uptrend. However, the price is now consolidating and is likely to be the 'Range Market' which is inside the green area.
In the 'Range Market' the price will usually move in that area and traders can usually use a market like this to buy when it is below the range area and sell above the range area. The price now has the possibility to try to touch the price again around $ 0.4370 and if the price can hold around it, then most likely the price will rise again to reach $ 0.62630 or even break that level due to the strong price increase that occurred on September 18 to September 21. However, if the price closes below the green area or below the support level it is likely that the price will fall to the next level which is at $ 0.3675.
Points to understand:
- Timeframe- Daily
- Trend - Ranging
- Momentum - Bullish
- Resistance Level - $ 0.6263 (yellow line)
- Support Level - $ 0.4357 (red line)