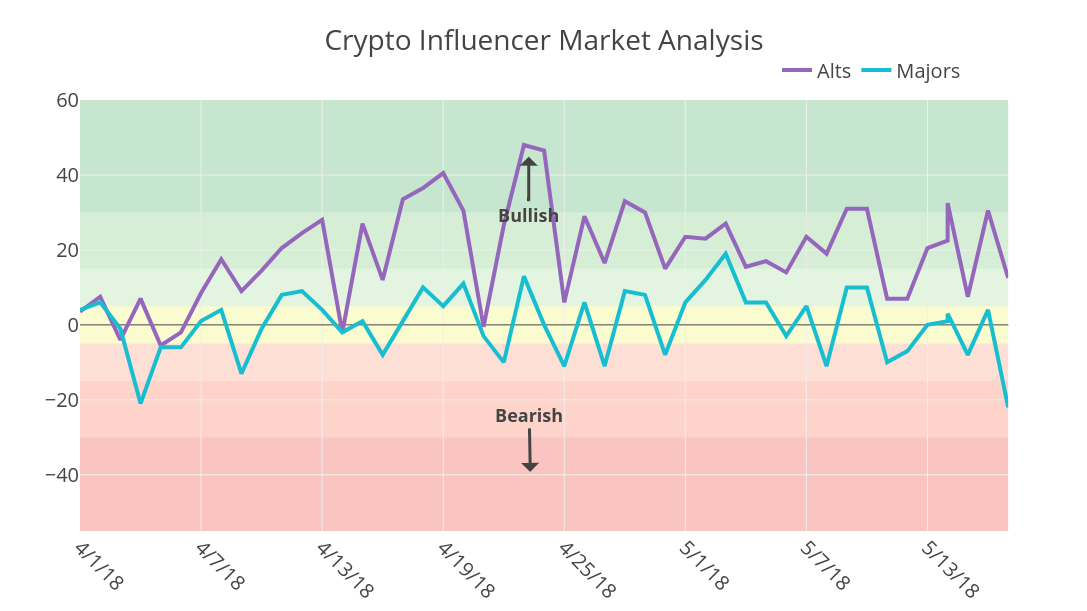
Sentiment reversal: $BTC, majors break positive trend line in place since early April
.png)
Not a lot of good news in the markets today.
Even less encouraging is this: For the first time in about a month and a half, sentiment on the major currencies broke a trend line that had been in place and helped buoy the alt market for the better part of April and early May.
Sentiment on $BTC, $ETH, $LTC and $BCH fell to -22, cruising through the bottom sentiment level during that period by about a dozen points. Surveying the social media activity of the 40 influencers and traders I follow, I can't find much short-term or medium-term optimism.
.png)
Call it the Consensus thump. Here's all the bloody data for the day. Trade safe, folks.
| Coin | Positive | Neutral | Negative | Total Mentions | Power |
|---|---|---|---|---|---|
| BTC | 0 | 2 | 13 | 15 | -13 |
| ETH | 1 | 1 | 5 | 7 | -4 |
| LTC | 0 | 0 | 3 | 3 | -3 |
| BCH | 0 | 0 | 2 | 2 | -2 |
| ALTS | 51 | 5 | 8 | 64 | 11.5 |
The Influencers
Who am I?
I'm an investigative data journalist during the day, and I've been looking for a way to cut through the noise and get a true sense of what some of the biggest crypto influencers are pushing toward and pulling away from.
Using a pseudonym here because I can't post about this shit on my verified accounts. I've become mildly obsessed with crypto and its constant stream of data and needed an outlet. So here I am.
What is this?
Each week, I scrape the Twitter accounts of some of the crypto world's favorite influencers, traders and TA folk. I run a basic sentiment analysis to see which coins they are mentioning positively, in a neutral way and which they are mentioning in a negative light.
I calculate "power" simply by subtracting negative mentions from positive ones to give an aggregate score. The higher the score, the better, the lower the worse. For the daily rankings, I also create aggregate scores for the majors and the Alt markets. The Alts get a 10 point deduction any time the majors go below zero, since overall the Alt-market has a tough time staying above water when BTC is in a spiral.
This isn't financial advice, just my own way of trying to make sense of what's out there. And as with most things, the more data I collect, hopefully, the more interesting it'll be. This is a work in progress. Please leave suggestions on how to make it better. I imagine if I keep up with it, I'll be able to expand a bunch of the analysis, but I wanted to start somewhere.
Thanks for the info!