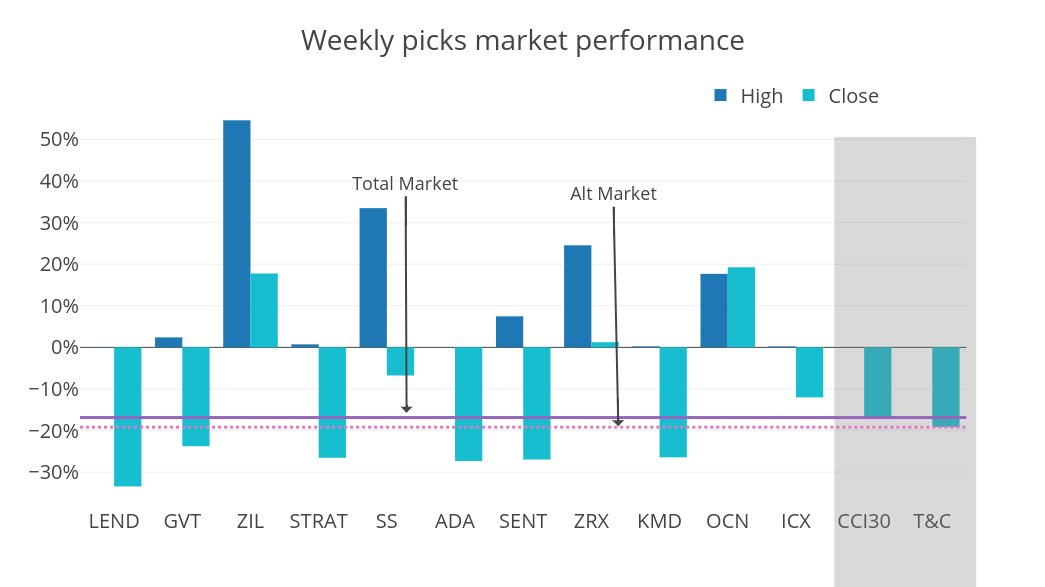
How my top 11 coins performed against the market this week
.png) On a week like this, I'll take 5 of 11.
On a week like this, I'll take 5 of 11.
$BTC got hammered this week, which brought most of the market down with it. And even all the positive sentiment in the world couldn't save the majority of my top 11 from last week.
As I do every week, I pitted my picks against two indices, the CCI30 (total market) and the T&C Altcoin Index (Alt Market) . And this week was... disappointing.
I'm pretty stoked that 5 of my picks — $ZIL, $SS, $ZRX, $OCN and $ICX — performed better than the market on a bad week, in some cases tremendously so.
$ZIL and $OCN crushed it, each posting more than 17% gains on a week when the market was down just as much. You could've also caught $SS for a 30% gain if you got out at the right time. $ZRX is simply unstoppable and a late week charge by $ICX had it losing 5 to 10 percent less than the market.
But I can't overlook the fact that the rest did worse. As I said last week, the movements of $BTC loom large here. I'm planning to start including a $BTC overview with all of my weekly stories, just to provide myself and others info that could reveal something that would throw a wrench in the works.
I'm also going to start pointing out when coins have been on the weekly chart for a number of weeks, to give folks a sense of when a coin really has a lasting push behind it (see: $OCN).
It's a work in progress, as I said. Bad weeks are sometimes better than good ones, because I can tweak and make this better.
As always, here's the data behind the chart above.
| Coin | Open | High | Close | % Change High | % Change Close |
|---|---|---|---|---|---|
| LEND | $0.09 | $0.09 | $0.06 | 0.08% | -33.44% |
| GVT | $23.73 | $24.30 | $18.09 | 2.40% | -23.77% |
| ZIL | $0.15 | $0.23 | $0.18 | 54.60% | 17.76% |
| STRAT | $8.21 | $8.27 | $6.03 | 0.73% | -26.55% |
| SS | $0.09 | $0.13 | $0.09 | 33.48% | -6.76% |
| ADA | $0.37 | $0.37 | $0.27 | 0.00% | -27.32% |
| SENT | $0.02 | $0.03 | $0.02 | 7.46% | -26.97% |
| ZRX | $1.63 | $2.03 | $1.65 | 24.54% | 1.23% |
| KMD | $4.16 | $4.17 | $3.06 | 0.24% | -26.44% |
| OCN | $0.03 | $0.04 | $0.04 | 17.68% | 19.26% |
| ICX | $4.41 | $4.42 | $3.88 | 0.23% | -12.02% |
| CCI30 | $10,819.00 | $10,819 | $8,977 | 0.00% | -17.03% |
| T&C | $9,106.00 | $9,106 | $7,360 | 0.00% | -19.17% |
The Influencers
Who am I?
I'm an investigative data journalist during the day, and I've been looking for a way to cut through the noise and get a true sense of what some of the biggest crypto influencers are pushing toward and pulling away from.
Using a pseudonym here because I can't post about this shit on my verified accounts. I've become mildly obsessed with crypto and its constant stream of data and needed an outlet. So here I am.
What is this?
Each week, I scrape the Twitter accounts of some of the crypto world's favorite influencers, traders and TA folk. I run a basic sentiment analysis to see which coins they are mentioning positively, in a neutral way and which they are mentioning in a negative light.
I calculate "power" simply by subtracting negative mentions from positive ones to give an aggregate score. The higher the score, the better, the lower the worse. For the daily rankings, I also create aggregate scores for the majors and the Alt markets. The Alts get a 10 point deduction any time the majors go below zero, since overall the Alt-market has a tough time staying above water when BTC is in a spiral.
This isn't financial advice, just my own way of trying to make sense of what's out there. And as with most things, the more data I collect, hopefully, the more interesting it'll be. This is a work in progress. Please leave suggestions on how to make it better. I imagine if I keep up with it, I'll be able to expand a bunch of the analysis, but I wanted to start somewhere.