#Eos Detailed analysis( Bull run -Correction phase-Future targets for $eosbtc )
Eos analysis
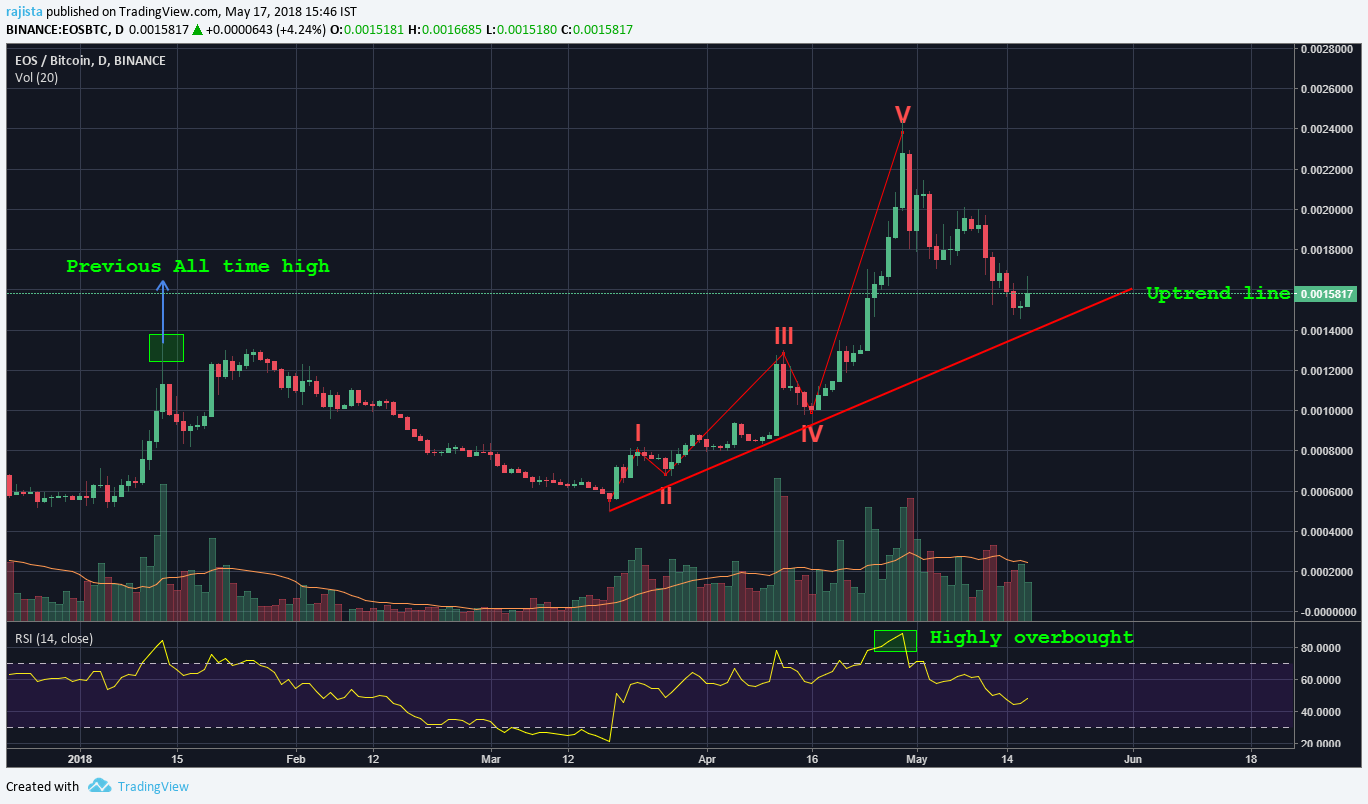
Eos went for a major bull run from 19 March to 29 April where it surged from 50ksats-244ksats ( Growth in 41days- +388%) this is termed in elliot wave terminology as a 1-5 impulsive wave sequence.
Eos broke previous all time highs of 13.3ksats(made on 13 Jan) on 24 April, then it went on to price discovery mode.
When a coin goes into price discovery mode we use fibonnaci extensions of the 1st impulsive wave to judge future resistance levels and subsequently target levels for next impulsive waves.
.png)
1st impulsive Wave- Wave 1 was from 50ksats-81.5ksats
Wave 2 was a retracement wave around the 38.2% retrace of wave 1(bullish retrace)
Wave 3 was 1.886 fib extension of Wave 1
.png)
Wave 4 was a retracement wave around 50% retrace of wave 3(bearish retrace)
Rules of alternation in elliot wave theory says that if one retracement wave is bullish then the other retracement will be more bearish.
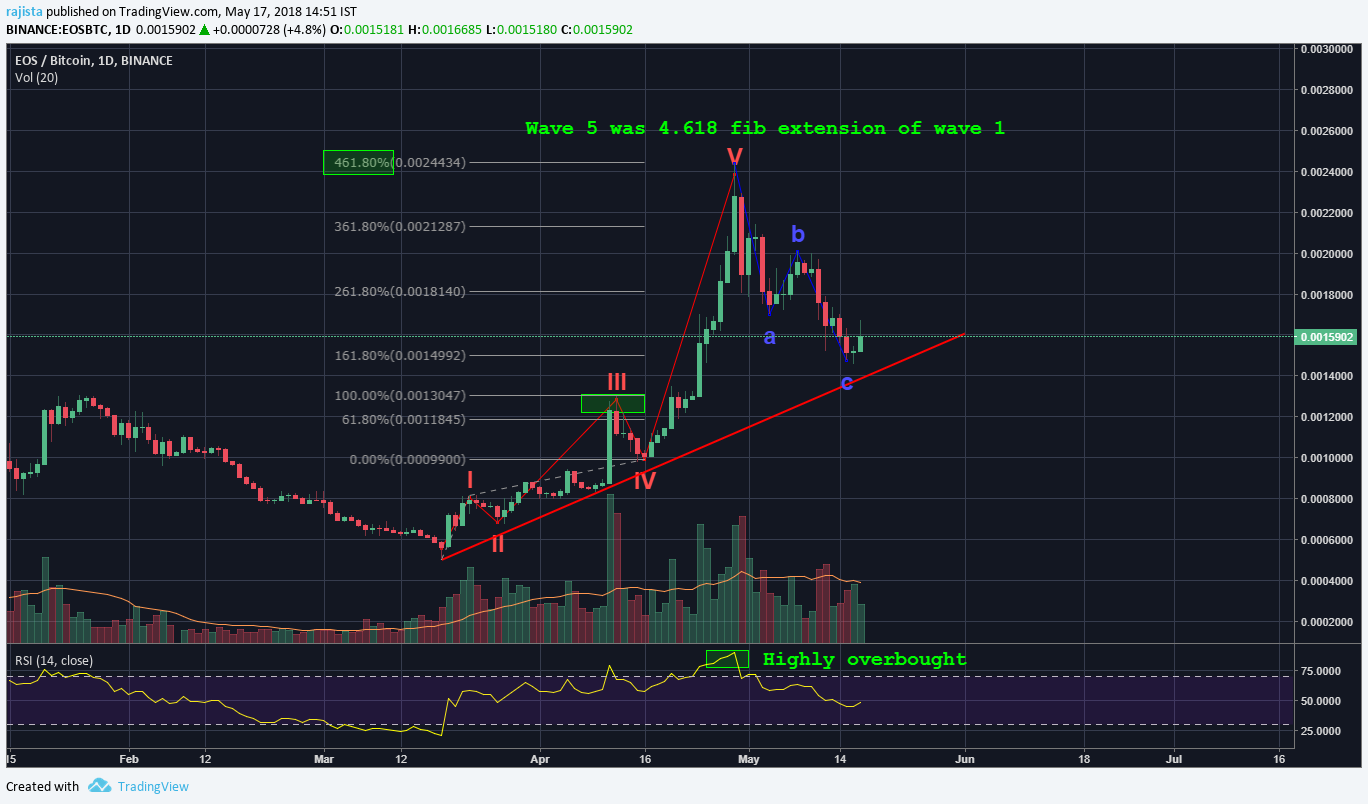
Finally the Wave 5 was 4.618 fib extension of Wave 1 making an all time high of 244ksats on 29April
.png)
Then after 29 April the Daily RSI level reached 89( RSI above 70 is termed as overbought so eos was highly overbought ). Consequently, we saw a correction as the supply was higher than the demand for eos (as eos was so highly priced around 29 April, so buyer's interests went on decreasing)
Correction we have seen till now is an ABC ZIg-ZIg type of correction , where:
Wave A is downwards
Wave B is upwards
Wave C is downwards
Then to calculate various correction target levels we use fibonacci retracement levels which act as levels of support and resistance for the price.
.png)
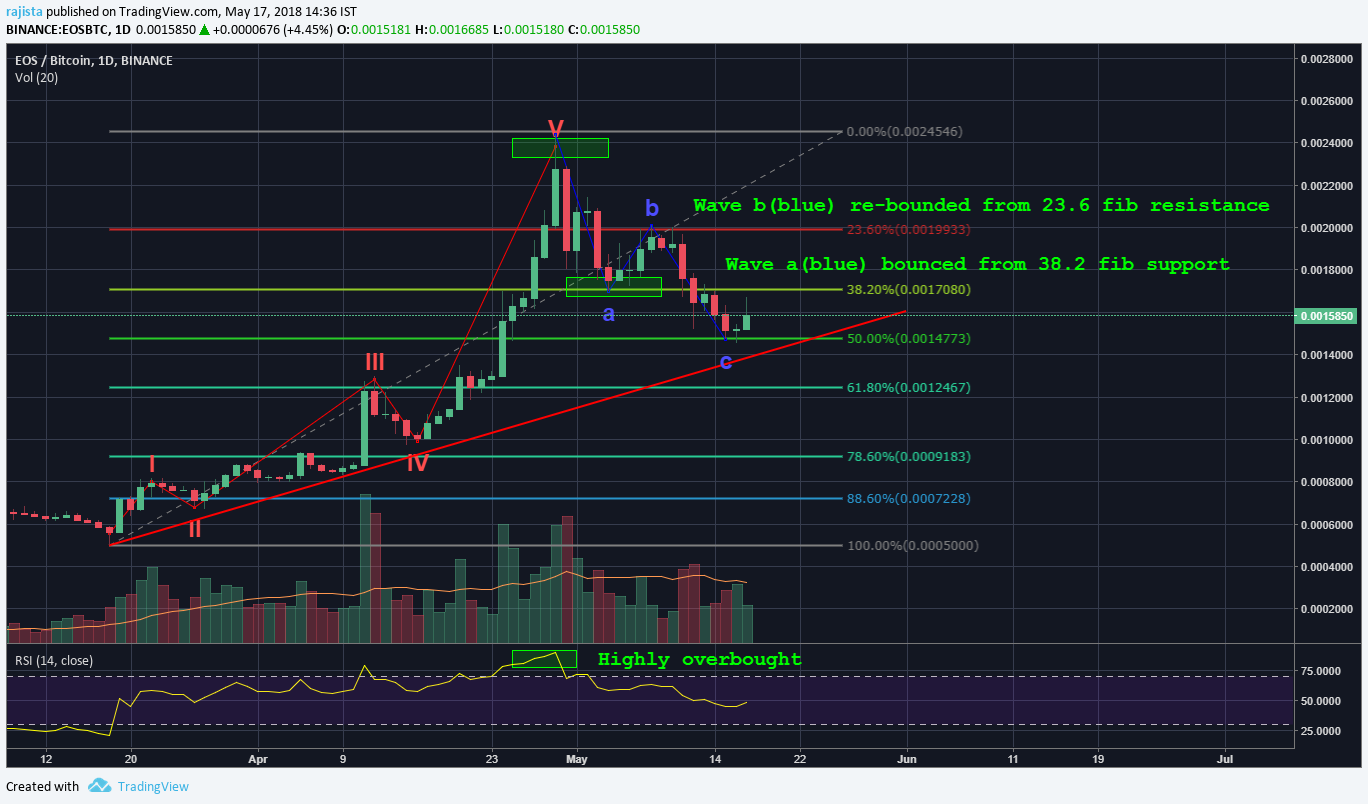
During the correction, firstly we saw that Wave A (downwards) found support at the 38.2fib level consequently it bounced off that level to reach 23.6fib resistance level.
Hence Wave B (upwards) was from the 38.2fib support to 23.6fib resistance
.png)
Then Wave C broke below the 38.2fib support level -170ksats and went on to test the 50fib support level i.e 147ksats.
Wave C till now has reached beyond 0.618 extension of Wave A
.png)
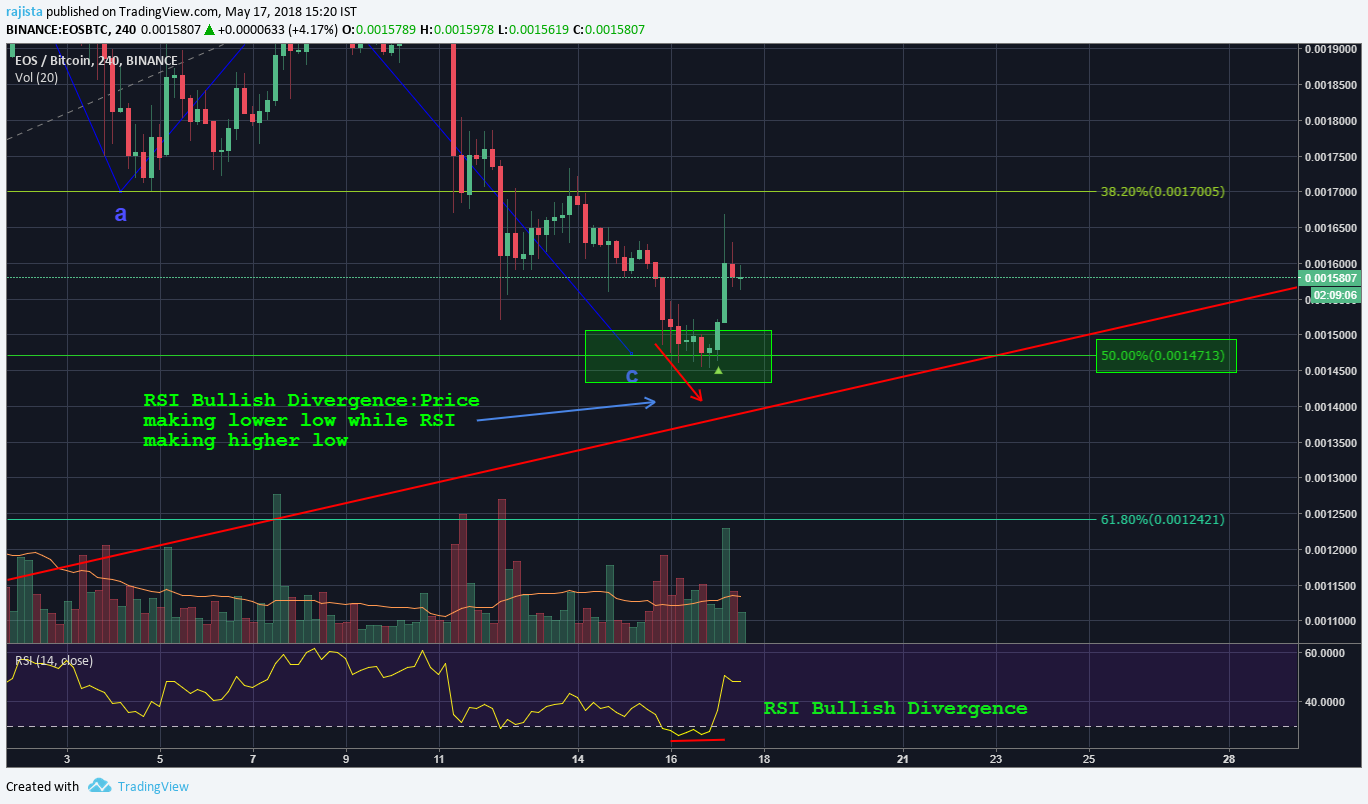
When eos was testing that 50fib support level, we saw Bullish DIvergence in RSI in 4hourly time-frame.
Bullish DIvergence- When Price makes lower low, while RSI makes higher low
It is a trend reversal signal for any coin/stock/commodity if we get this divergence around important support levels, Like 50 fib support at 147ksats in this case for #eos.
.png)
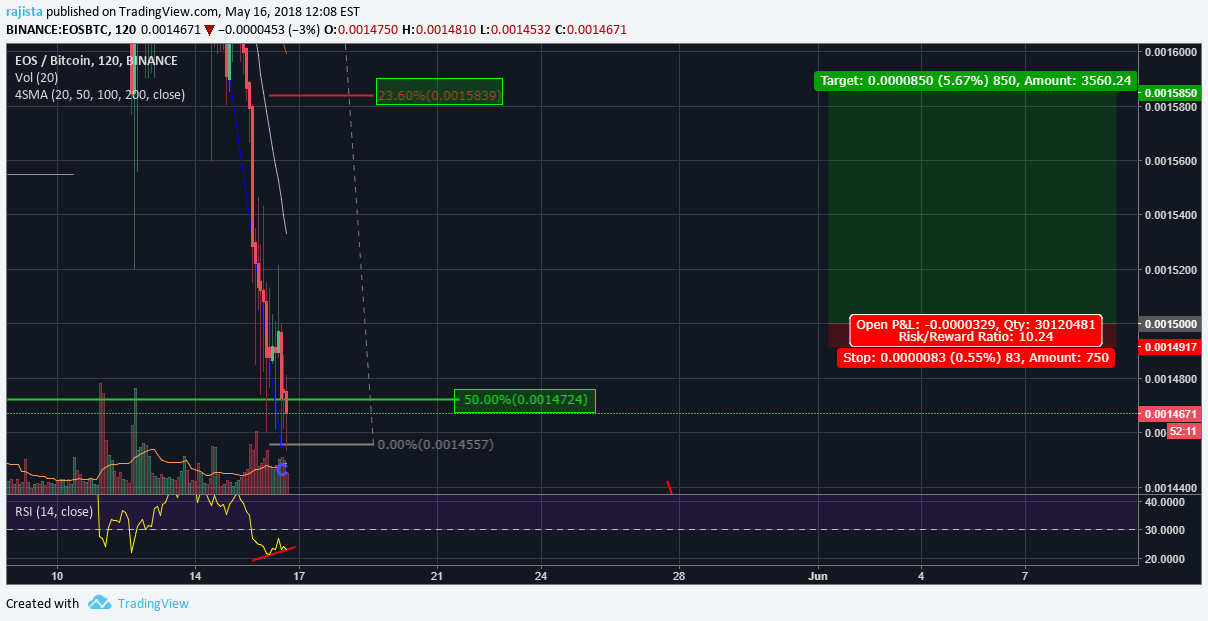
Spotting this signal i made a long call on eos:
Targeting atleast the 23.6fib retracement level (158ksats) of the Wave C
Open price was taken at the high of previous candle in 4hourly time frame to catch the upward momentum and not getting stuck with a falling knife in case of things going south.
Trade 1 setup was as follows:
Open Long- 150ksats, Target1-158ksats, Target2-165ksats, Target3-172ksats
Stoploss- 149ksats
Risk:Reward- 10.3 for target 1.
Target1: 158ksats around:23.6fib retrace of wave c & 4H 20 & 200SMA resistance level .
Target2 & 3 around 38.2 & 50fib of wave c respectively.
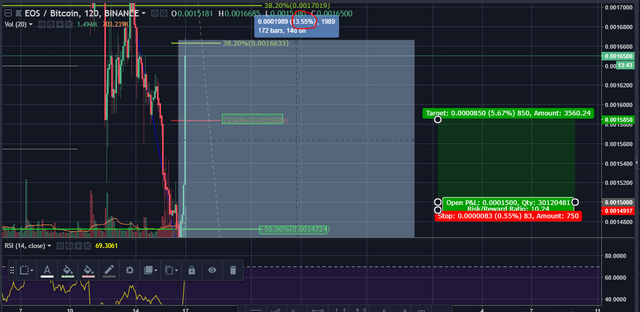
This trade has been closed now at 10% profit with Target 2 getting achieved
.png)
.png)
https://www.tradingview.com/chart/EOSBTC/90mZjjGE-EOS-Long-setup-If-bounce-above-50fib-i-e-147ksat-is-confirmed/
SInce then Eos has jumped 14% after i made the call to go long on $eos
https://twitter.com/rajista007/status/996940981533523970
Now next scenarios for $eos are as follows:
After that 14% jump from the 50fib support(147ksats)level $eos went beyond the 23.6fib resistance of Wave C as per my Target 1 in above trade setup till the 38.2fib resistance(166ksats) of wave C, hence achieving the Target 2 level(check above)
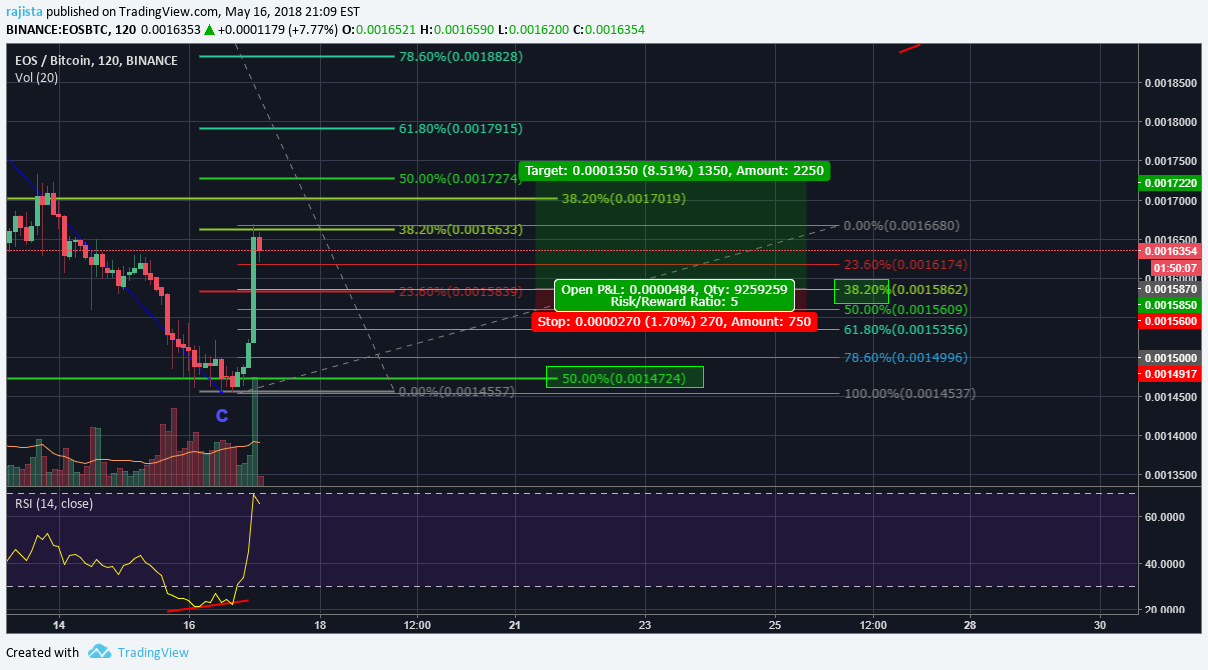.png)
https://www.tradingview.com/chart/EOSBTC/qpn546kg-Eos-Trade-Setup-another-LONG-on-EOSBTC-around-38-2-fib-retrace/
I am looking to go for another LONG on #EOSBTC at 38.2 fib retrace
Open-158.5ksats
Target-172ksats
Stoploss-156ksats Risk-1.7%, R:R=5
This trade is live right now!!
You can check the progress by clicking on the above Tradingview link.
If you find the above article useful, kindly hit the link and follow button in order to not miss any update, as i regularly analyse opportunities like this, on a daily basis & just in case if you are in a tipping mood you can buy me a beverage :)
LTC: LRapgEkUPwV2qENjtt3NEH8d4PPvW3sFfm
XRP Address: rEb8TK3gBgk5auZkwc6sHnwrGVJH8DuaLh XRP Tag: 778576383
BTC: 1LM7tHMvLSghnBw2WTk3MSvfDyiGP5uGpd
ETH: 0x47eefeeea7e7b0d0840e841fbf3b3ab28ea86f88
Complete and easy to understand step-by-step guide to set up a position. Really useful for everyone that is approaching trading. Great work, you earned one follower! Keep it up!
Coins mentioned in post: