ETH going to $80k? This chart shows WHEN.
Hello, world!
Let’s see what opportunities we can find with help of Universal-Sequential-0.101
ETHEREUM
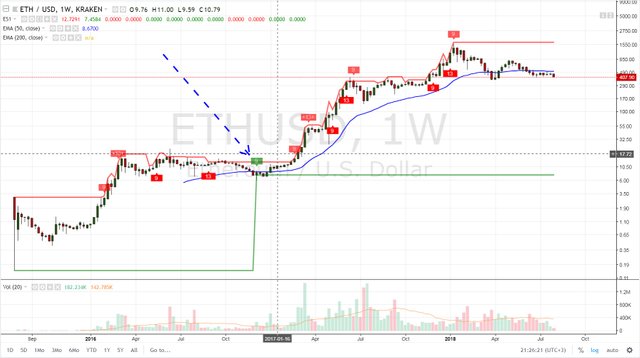
Most likely scenario: Green 9 (setup) to show up on the weekly chart.
Unlike BTC/USD that are waiting for green 9 on both : weekly and 4-day timeframes, ETH/USD 4-day already had a green 9, and Oversell (green line) popped over red line (Overbuy) which is bullish sign 
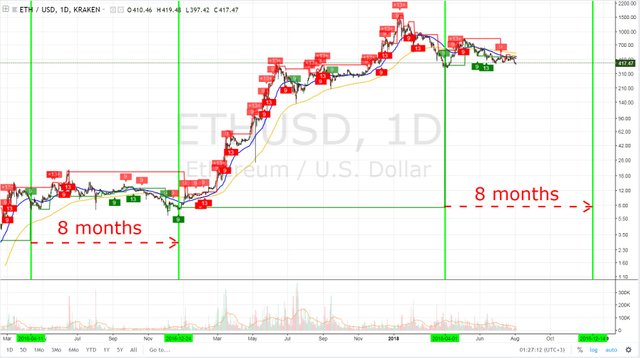
If we look back in history and do a simple time analysis on the daily chart by starting it from the day of Oversells popping above the red line (11-04-2016) and until the day it popped below the red line (24-12-2016), you can do simple math and see that it took 8 months to accumulate.
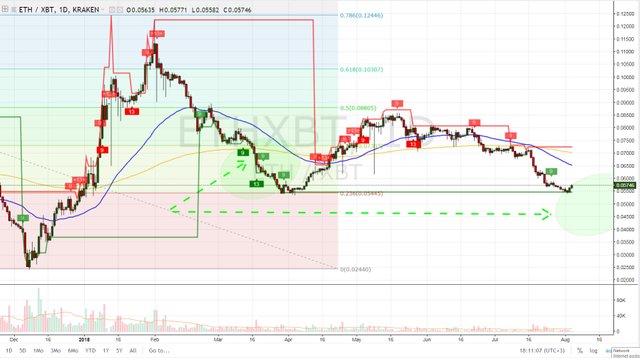
Relatively to BTC, ETH looks sweet.
Looking at how much ETH pumped after that previous consolidation period of 8 months, early 2019 could be looking very good for ETH.
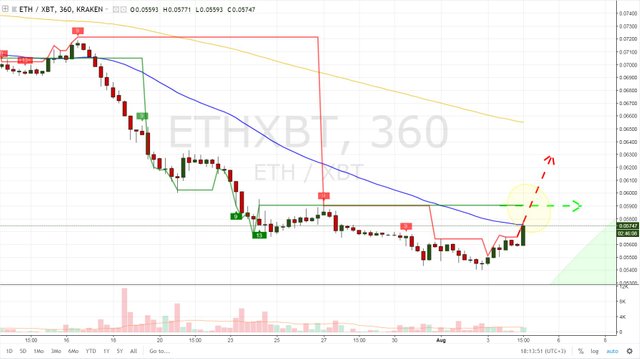
On the 6-hour chart, Overbuy popped under Oversell, which invites us for a short run to red 9.
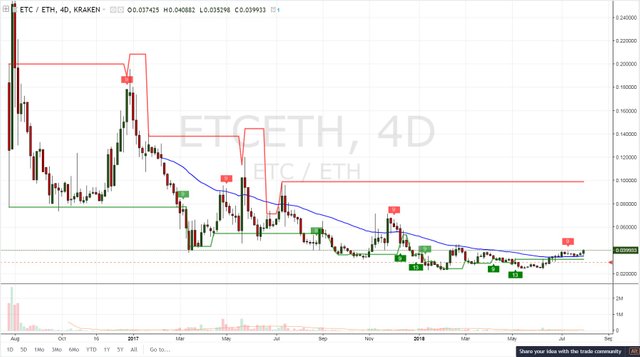
ETHEREUM CLASSIC
Now what interesting here is Ethereum Classic
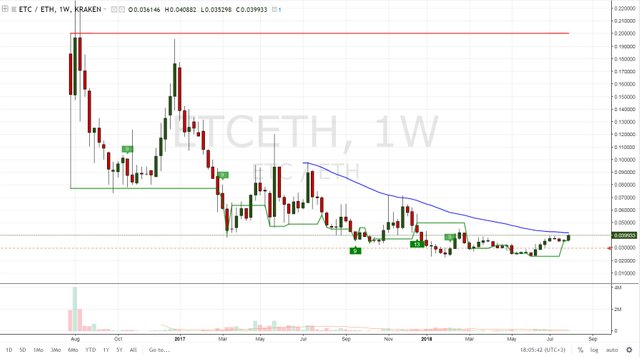
Right now, ETC relative to ETH is even better than ETH relative to BTC.
What do you think about all these charts? And please write in comments below which pairs you wish me to talk about in next article.