Understanding the market depth chart
Market depth is a very simple yet a powerful tool to get various instant information about a stock or a coin(in the crypto world). There would hardly be any expert trader who won't look at market depth before going for any trades. The consultants too check the market depth first and then give the recommendation of stock or coin to be purchased.
Market depth is so popular that almost every trading exchange provides it as a default statistics measure for the market.
What Information do We Get From Market Depth Graph?
More information in less time:
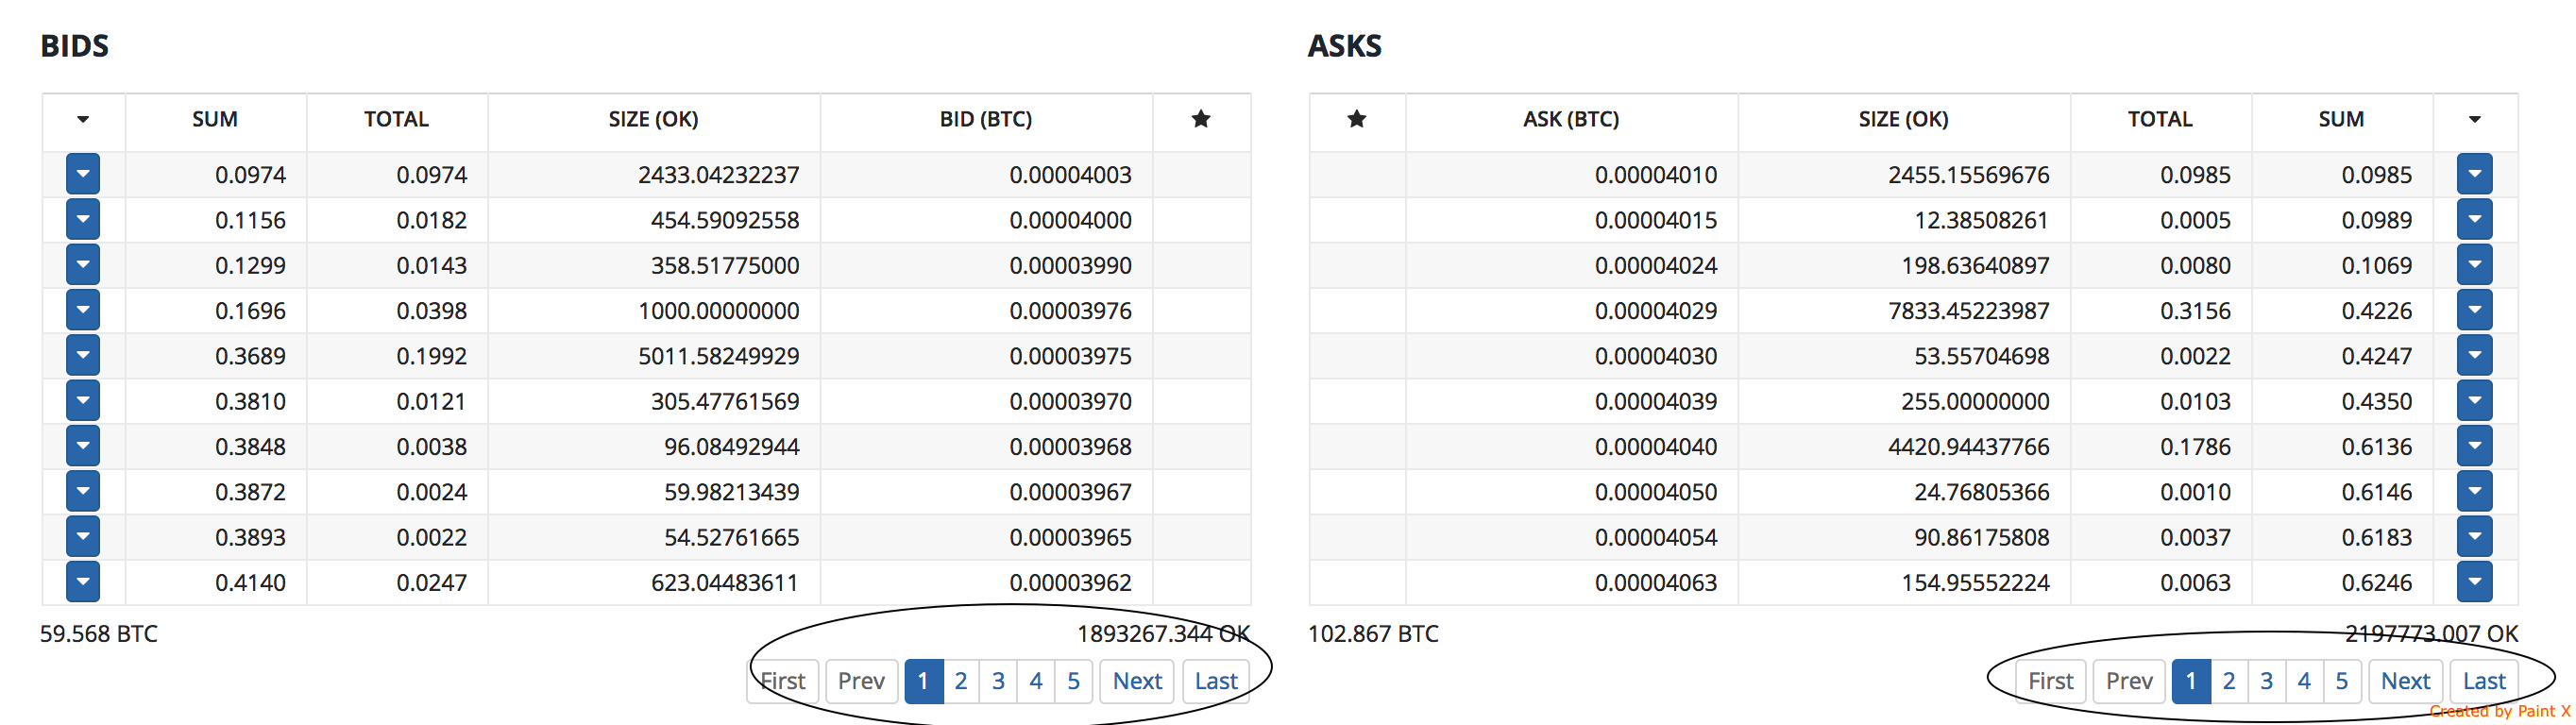
Market depth chart gives us the statistics of the bids and asks in a single glance which is far more efficient than just going to different pages of bids and asks. The market depth chart is similar to the auction yard, but here you see all the bids and asks in a single glance.
Selling or Buying pressure?
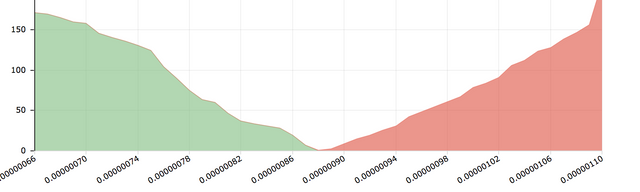
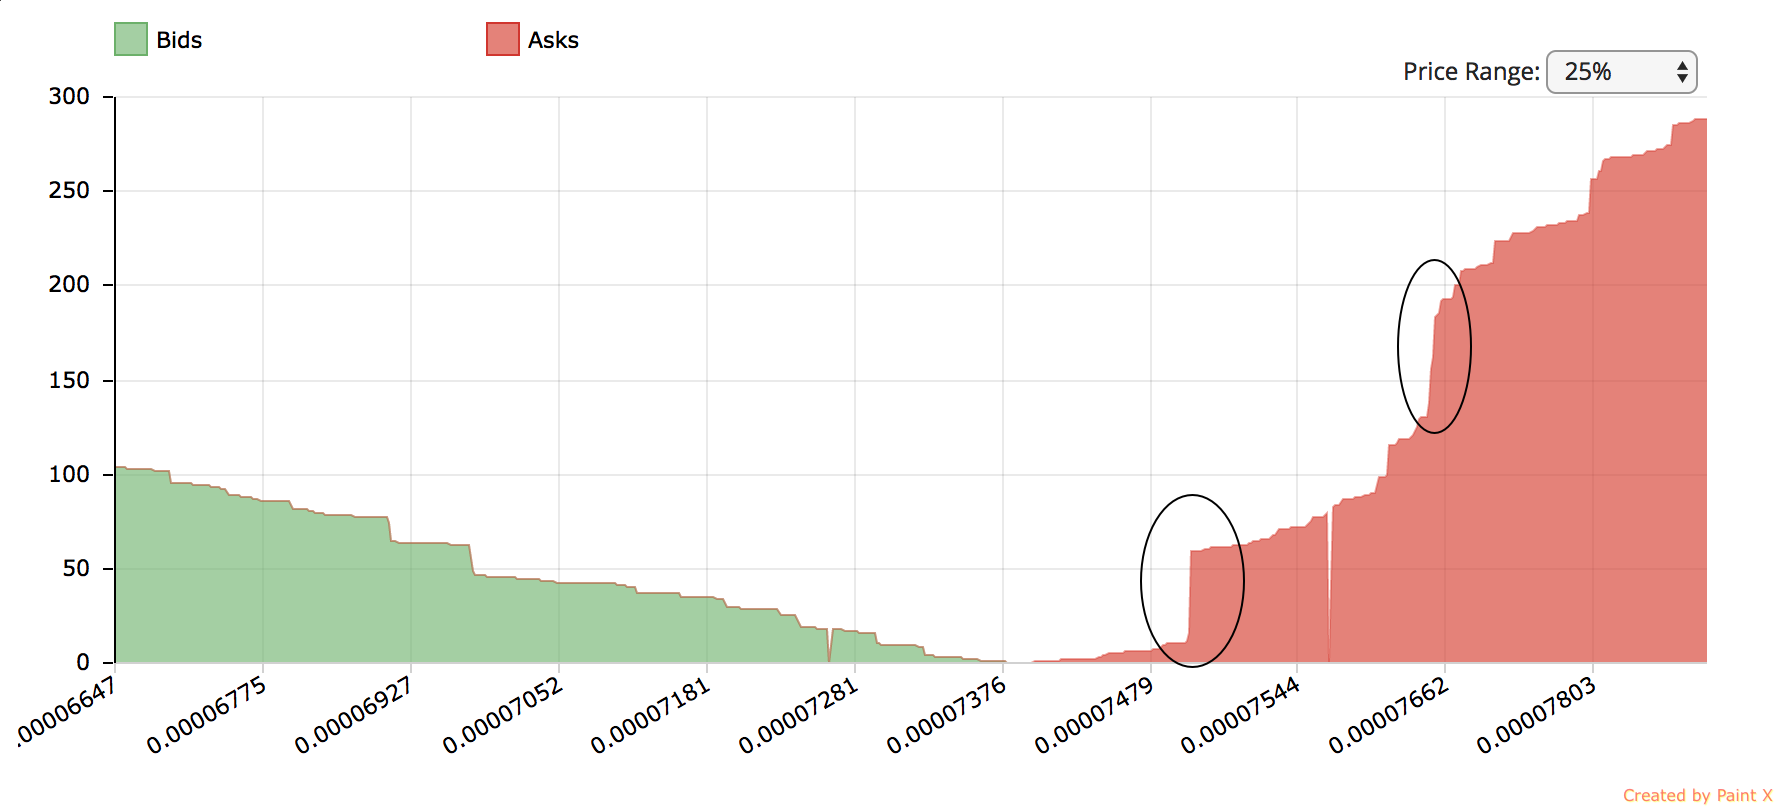
At a given point in time, market depth graph tells us if there are more units to be sold(sellers) or to be bought(buyers). When there are more buyers than sellers, the price is likely to go up, and if the opposite is true, then the rate is expected to go down. This is based on the simple fundamentals of demand and supply. If a market has more buyers than sellers, the need is high, and the cost is likely to shoot up and vice versa.
In the above graph, there are more buyers than sellers, so the price is likely to go up. So, a better strategy is to buy now or do not place a very low bid.
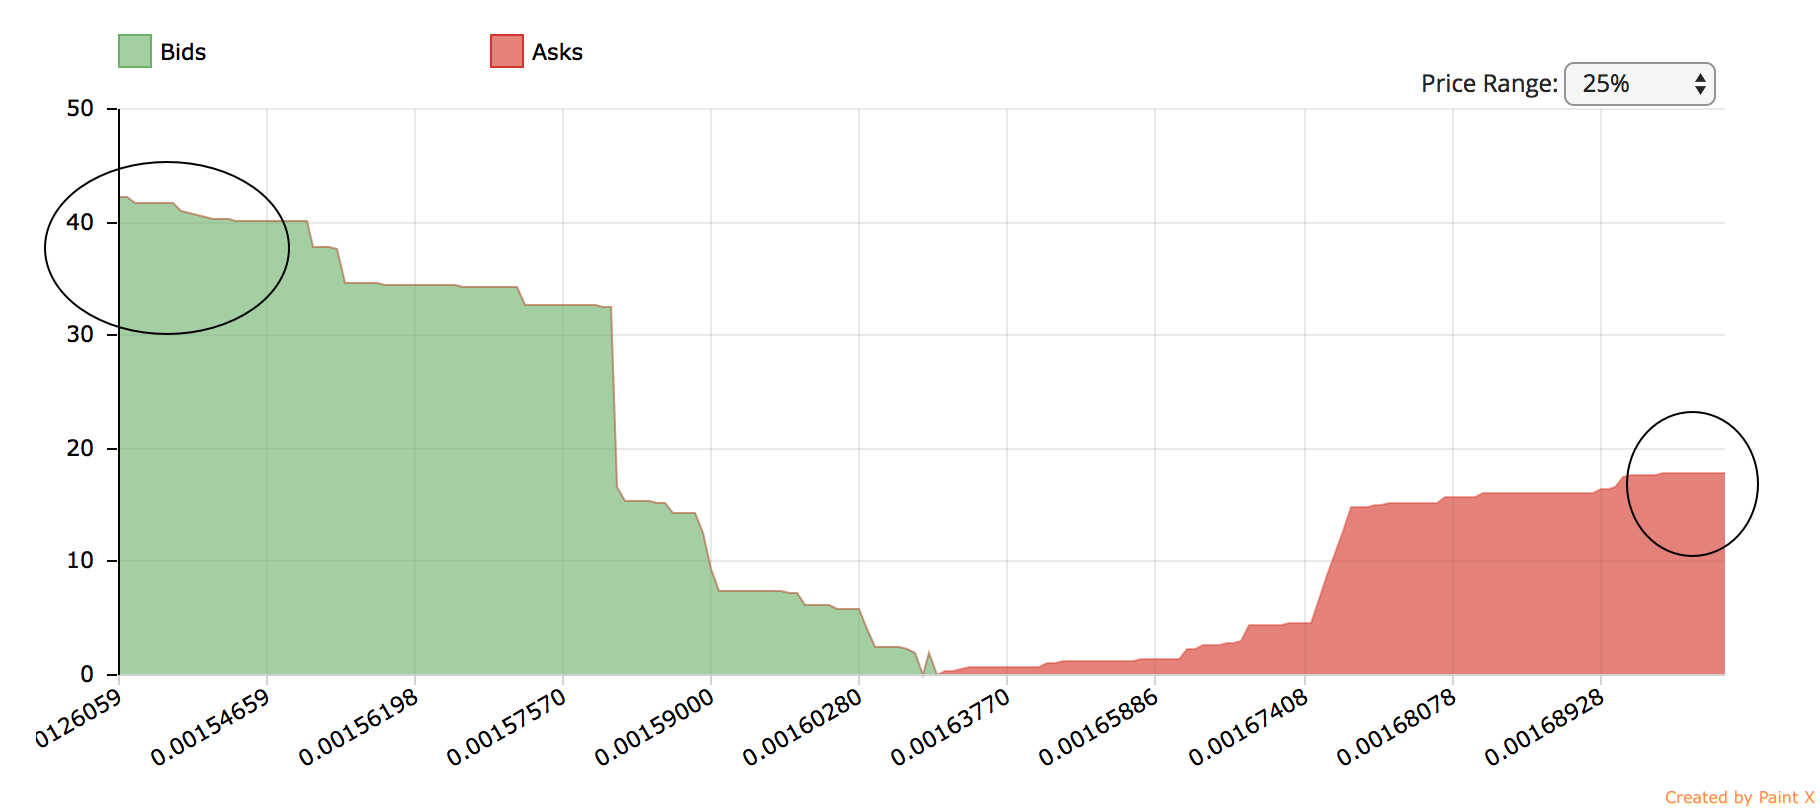
Support level:
The support level gives us a point beyond which a coin or stock highly unlikely to drop. It means people have put a lot of amount in a bid for the same price and 1st all of those bids need to be executed before it goes down further. If the price drop below this support level, then chances of dropping that coin goes down to the next support level.
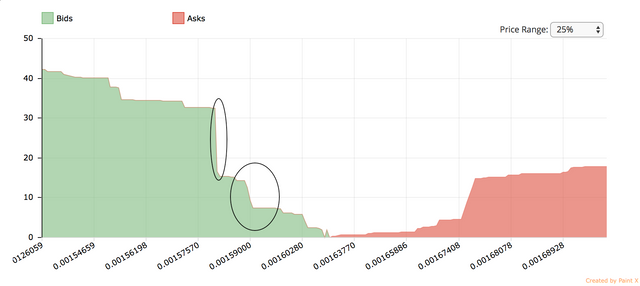
Resistance level
The resistance level gives us a point above which a coin is highly unlikely to grow. It means people have put a lot of amount in an ask for the same price and 1st all of those askings need to be executed before it goes up further. If the price increases above this support level, then chances of increasing that coin goes up to the next resistance level.

@original