BTC is at $3713. 2 Charts Indicating Buy Now!
BTC is up ~3.4% for the day. Using Andrew's Pitchfork, we can look at 2 different charts to see the support and resistance levels for BTC/USD.
Both charts have their limitations, and there is subjectivity introduced when drawing the pitchfork pattern. Nonetheless, both charts provide good context to recent BTC price movement.
1) Ignoring the highs
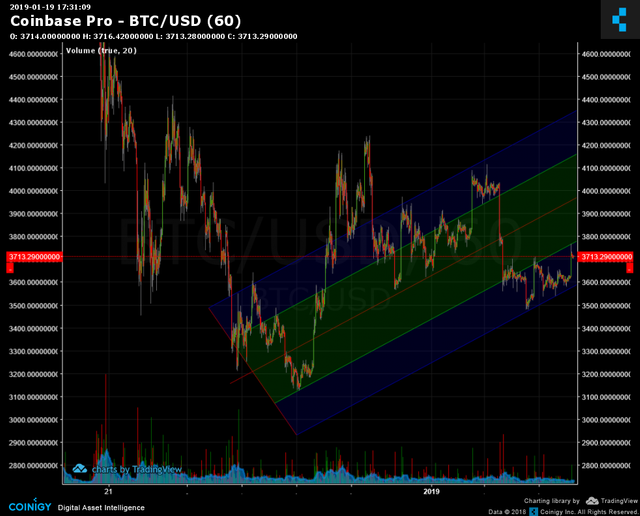
This chart indicates the bulls are attempting to retake the middle channel at ~$3800, and strong support (shown from the last 24 hr price action) exists at ~$3600. This is bad news for the shorts who were looking for BTC to fall to lower support lines at $2200, which I wrote about previously, here.
2) Ignoring the lows
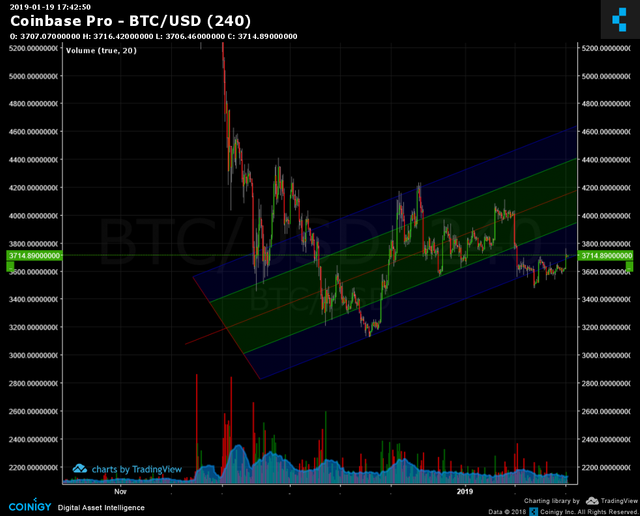
In this version, the highs are factored in, thus showing a reinforced price support level at current prices (~$3700). This chart supports an entry price at current levels, as prices are likely to move higher within the middle pitchfork channel. Those that enter in at 3700 will face resistance near 4000 (green channel).
2 Different Pictures, Both Indicating Bullish BTC movement
Disclaimer: This is not financial advice. Please do your own due diligence as cryptocurrencies are still very speculative investments. Please only invest what you can afford to lose.
Happy Trading,
PS

Congratulations @psteemy! You have completed the following achievement on the Steem blockchain and have been rewarded with new badge(s) :
Click here to view your Board
If you no longer want to receive notifications, reply to this comment with the word
STOP