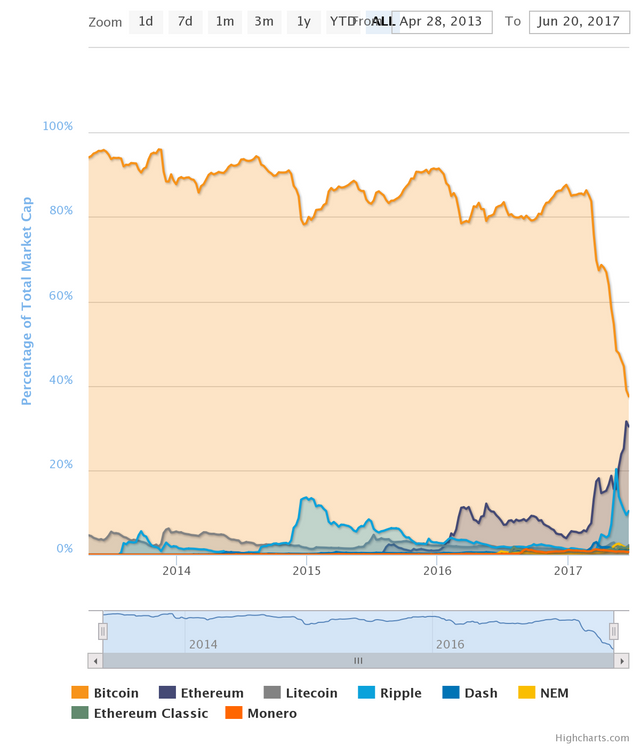
Percentage of Total Market Capitalization (Dominance): This picture is worth million words
The picture shows how market cap dominance is changing abrutply in last 4 months. Will it follow this path or revert back?
The picture shows how market cap dominance is changing abrutply in last 4 months. Will it follow this path or revert back?
Over the past few months, the Bitcoin network became drastically slowed down, due to a very high amount of transactions on the network. This caused other people to look towards altcoins, which offered faster transaction times and lower fees than Bitcoin. Also, lately Ethereum has been doing very well, and this could be attributed towards the hundreds of Initial Coin Offerings (ICO's) that are launching on the Ethereum platform. I hope this explains the graph a little better. There are plenty of other factors at play, too, but I feel that the above mentioned ones are the main ones.
@callumcampbell : your analysis is very good. But question remains is this the right thing happening or bad?
Well, the only way the Bitcoin network would have come to a consensus, is if pressure was put on them. The community needed to see that if we couldn't agree on anything, we were gonna lose our spot as the #1 crypto