Predicting the overall Crypto market, looking at XRP chart
Yes, you read it right, I switched the usuall Bitcoin analysis for XRP, when it comes to predicting the overall movement of coins and tokens.
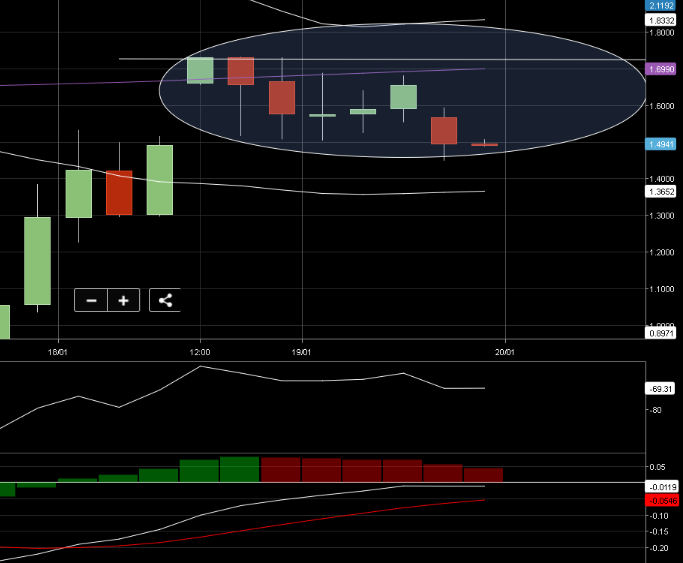
A nice upward gap, usually a good thing when a break of the high happens in the first 4 following candles, which didn't happen. So this is a bearish movement for me. A pullback is expected, after this first signal of recovery in the market. Maybe to the MA 21, around $1,36, or even to the lower band $0,9. The latter is the more probable one, usuall movement when the price goes sideways. Buy on the lower band, sell on the higher band.
I also expect everyother cryptocurrency to act similarly to this.
This is my own opinion. Don't use it has financial advice.
For my predictions, I use a technical analysis trading setup I explained here, and also my knowledge of other setups along with common support and resistence lines, and Fibonacci levels.
As you can see I don't have a huge following base, so if you want, you can help me by resteeming this post.
Thank You!