Price analysis for: Bitcoin, ethereum, litecoin, and Ripple: February 11

Technical analysis for both Bitcoin, ethereum, litecoin, and Ripple. These analyzes reflect the current market, and identify points of sale and buying on different time frames.
IMPORTANT NOTICE: Trade is on your own responsibility, and the accompanying analysis reflects the current market trend.
- BTC / USDT:
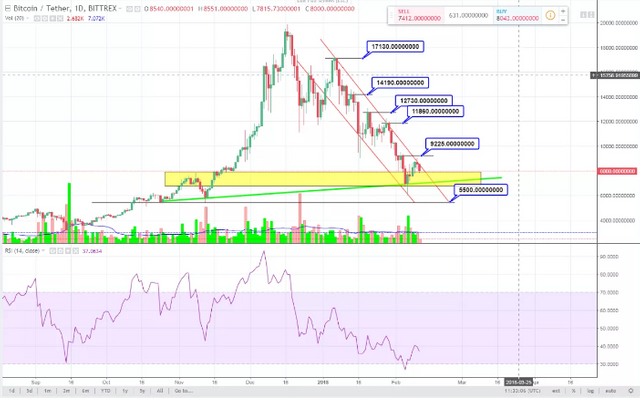
We see here in the daily time frame, and with the beginning of February 11, 2018, that the price has continued so far in the bearish channel, starting from $ 17130 to $ 6,000, reaching a strong support area between $ 6,600 and $ 8,000, The price continues to rise until February 9, 2018, to touch the downward trend line on February 10, 2018, in an attempt to break through the bearish channel, and the price is once again falling to touch the strong support area of $ 8000 to settle at $ 8550.
The strong test now lies in the support area; if breached, the price is likely to reach $ 5,500.
- ETH / BTC:
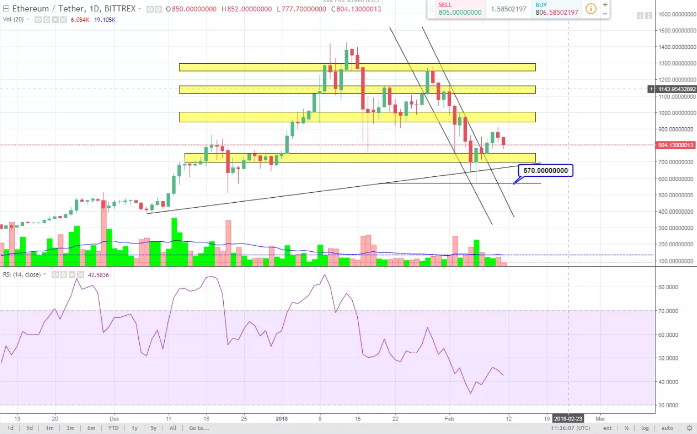
We see here in the daily time frame, and with the beginning of 7 February 2018, that the prices touched the downward trend line in the channel in an attempt to break through it. The strong support area was between $ 690 and $ 750, supporting the deficit, Prices will rise on February 8 and 9, 2018, up to $ 883.
The bounce of the Pitcairn price negatively affected the market, with most of the currencies rebounding as the ETH price rebounded over the 10 and 11 February 2018 days, bringing the price to $ 800.
Prices are likely to fall again to reach the support area between $ 690 and $ 750, as we will see the currency's direction in the next few days.
3- LTC / BTC:
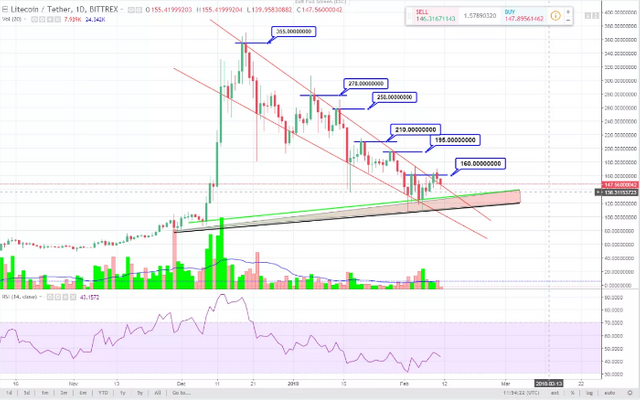
We note here in the daily time frame, and with the beginning of February 8, 2018, that prices are rising, as a positive sign of market improvement. The bearish channel was breached, with prices hitting the first resistance area at $ 160.
The bounce of the price of the Pitcairn negatively on the market, to bounce with most of the currencies, where the LTC rebounded over the two days 10 and 11 February 2018, bringing the price to 147 dollars.
If the price continues to fall, prices will range from $ 140 to $ 125, and if prices continue to fall, they will reach a new support level of $ 80....
- BTC / XRP:
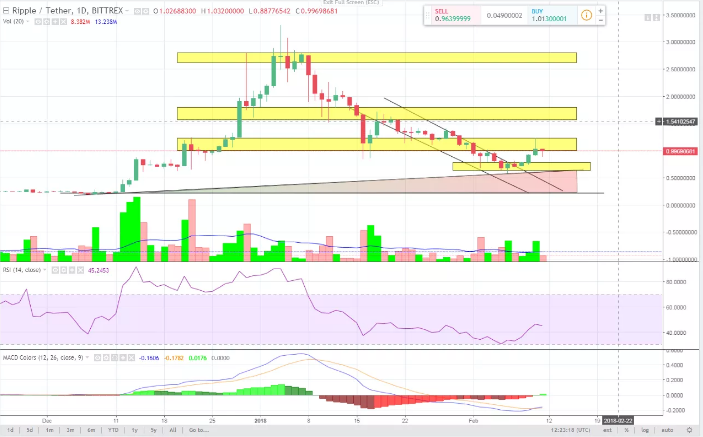
We see here in the daily time frame that prices have moved - as we explained in the analysis published on February 6, 2018 - prices broke through the bearish channel on February 8, 2018, beginning to rise to the resistance level between (1.2-1) USD, to touch prices to reach $ 1.226.
The price was unable to break through the strong resistance zone, given the decline of 11 February 2018.
The bounce rate of the Pitcin negatively on the market, to bounce with most of the currencies, including the XRP currency. Prices are likely to continue to fall to support between $ 0.57 and $ 0.78.
Don't miss out on my next post! Follow me @oroujda
Financial Analyst at steemit website, interested in the world of digital currencies and blockbuster technology